FTSE 100 trading platforms let you speculate FTSE 100 Index (Financial Times Stock Exchange) which is the primary blue chip stock index of the London Stock Exchange, often referred to as the ‘Footsie’ Index and contains 100 of the largest companies on the LSE by market capitalisation.
City Index: Best broker for FTSE 100 CFD trading
- Costs & spreads: 1
- Minimum deposit: £100
- Overnight financing: 2.5% +/- SONIA
- Account types: CFDs & spread betting
69% of retail investor accounts lose money when trading CFDs with this provider
Pepperstone: Automated FTSE trading on MT4
- Costs & spreads: 1
- Minimum deposit: £1
- Overnight financing: 2.9% +/- SONIA
- Account types: CFDs & spread betting
75.3% of retail investor accounts lose money when trading CFDs with this provider
Spreadex: FTSE trading with personal service
- Costs & spreads: 1
- Minimum deposit: £1
- Overnight financing: 3% +/- SONIA
- Account types: CFDs & spread betting
72% of retail investor accounts lose money when trading CFDs with this provider
Interactive Brokers: Discount FTSE trading & investing
- Costs & spreads: 0.005%
- Minimum deposit: $2,000
- Overnight financing: 1.5% +/- SONIA
- Account types: CFDs, DMA, futures & options
60% of retail investor accounts lose money when trading CFDs with this provider
CMC Markets: High-tech FTSE trading platform
- Costs & spreads: 1
- Minimum deposit: £1
- Overnight financing: 2.9% +/- SONIA
- Account types: CFDs & spread betting
74% of retail investor accounts lose money when trading CFDs with this provider
XTB: Good FTSE 100 trading educational material
- Costs & spreads: 1.7
- Minimum deposit: £1
- Equity overnight financing: -0.02341% / -0.00159% DAILY
- Account types: CFDs
81% of retail investor accounts lose money when trading CFDs with this provider
Saxo Markets: Best broker for FTSE 100 ETFs & investing
- Costs & spreads: 1
- Minimum deposit: £500
- Overnight financing: 2.5% +/- SAXO RATE
- Account types: CFDs, futures & options
70% of retail investor accounts lose money when trading CFDs with this provider
eToro: Copy other people’s FTSE trading
- Costs & spreads: 1.5
- Minimum deposit: $50
- Overnight financing: 6.4% +/- SONIA
- Account types: CFDs
51% of retail investor accounts lose money when trading CFDs with this provider. You should consider whether you can afford to take the high risk of losing your money
Tickmill: DMA FTSE futures trading on CQG or CFDs on MT4
- Costs & spreads: 0.9
- Minimum deposit: $100
- Account types: CFDs, futures & options
75% of retail investor accounts lose money when trading CFDs and spread bets with this provider
Methodology: We have chosen what we think are the best FTSE trading platforms based on:
- over 17,000 votes in our annual awards
- our own experiences testing the UK100 trading platforms with real money
- an in-depth comparison of the features that make them stand out compared to alternatives.
- interviews with the UKX trading platform CEOs and senior management
What's in this guide?
Compare FTSE 100 (UKX) Trading Platforms
| FTSE 100 Trading Platform | FTSE Trading Costs | Minimum Deposit | GMG Rating | More Info | Risk Warning |
|---|---|---|---|---|---|
 | 1 | £100 | See Platform | 69% of retail investor accounts lose money when trading CFDs with this provider | |
 | 1 | £1 | See Platform | 75.3% of retail investor accounts lose money when trading CFDs with this provider | |
 | 1 | £250 | See Platform | 70% of retail investor accounts lose money when trading CFDs and spread bets with this provider. | |
 | 1 | £1 | See Platform | 64% of retail investor accounts lose money when trading CFDs with this provider | |
 | 1 | £1 | See Platform | 65% of retail investor accounts lose money when trading CFDs with this provider | |
 | 1.5 | $50 | See Platform | 51% of retail investor accounts lose money when trading CFDs with this provider. You should consider whether you can afford to take the high risk of losing your money | |
 | 1.7 | £1 | See Platform | 77% of retail investor accounts lose money when trading CFDs with this provider | |
 | 0.005% | $2,000 | See Platform | 62.5% of retail investor accounts lose money when trading CFDs with this provider | |
 | 1 | £1 | See Platform | 69% of retail investor accounts lose money when trading CFDs with this provider | |
 | 0.9 | $100 | See Platform | 71% of retail investor accounts lose money when trading CFDs and spread bets with this provider | |
 | 1 | £100 | See Platform | 69% of retail investor accounts lose money when trading CFDs with this provider. | |
 | 0.7 | £10 | See Platform | 66.95% of retail investor accounts lose money when trading CFDs with this provider |
What is the FTSE 100?
The FTSE Index stands for Financial Times Stock Exchange 100 Index. This is the primary blue chip stock index of the London Stock Exchange, often referred to as the ‘Footsie’ Index. The number of stocks in the index is capped at 100.
How does the FTSE 100 work?
The index is a very popular stock market index in the UK. Formed in 1984, the index is currently maintained by the FTSE Group. The index is calculated throughout a trading session regularly.
The FTSE 100 Index is capitalisation weighted, meaning that larger stocks have a larger impact on the index movements. Below is a snapshot of the 10 largest stocks in the FTSE 100 Index.
The largest stock in the LSE right now is the pharma giant AstraZeneca, with a market cap of £173.4 billion. This is followed by the oil producer Shell at £173.2 billion. The banking behemoth HSBC is valued at £125 billion.
Top 10 FTSE 100 Companies
| Code | Name | Market Cap (m) |
| AZN | ASTRAZENECA PLC ORD SHS $0.25 | 173,495.51 |
| SHEL | SHELL PLC ORD EUR0.07 | 173,251.40 |
| HSBA | HSBC HLDGS PLC ORD $0.50 (UK REG) | 125,012.85 |
| ULVR | UNILEVER PLC ORD 3 1/9P | 102,574.04 |
| BP. | BP PLC $0.25 | 90,393.11 |
| DGE | DIAGEO PLC ORD 28 101/108P | 69,717.52 |
| RIO | RIO TINTO PLC ORD 10P | 63,618.36 |
| GSK | GSK PLC ORD 31 1/4P | 62,891.26 |
| BATS | BRITISH AMERICAN TOBACCO PLC ORD 25P | 58,637.89 |
| GLEN | GLENCORE PLC ORD USD0.01 | 55,932.39 |
Source: London Stock Exchange (see this FTSE Link for a calculation).
Why trade the FTSE 100 Index?
FTSE stock Indices (100 and FTSE 250) are closely watched. The index is attractive to investors and traders alike because:
- FTSE 100 stocks are highly international and these companies derived their earnings globally
- FTSE 100 offers good liquidity – as some of the FTSE stocks are huge (e.g. HSBC, BP, and GSK)
- FTSE 100 pays relatively good dividend yields compared to the UK bond yields
The City of London is a globalised arena and many companies choose to list there. Investors can get a good spread of stocks from across the world.
How to choose a FTSE 100 trading platform
We’ve put together a list of the best brokers and platforms for trading the FTSE 100 (UKX) by comparing account types, trading spreads, and overnight financing rates, plus interviewed, reviewed and tested the brokers trading platforms.
If it’s 24 hour pricing and tight spreads plus access to thousands of other products then you will probably want to trade with one of the larger brokers such as IG Group or Saxo Bank. But if you want a more personalised service then you might prefer a smaller broker such as Spreadex.
Your choice of broker will also be influenced by the products you want to trade for example, Pepperstone have a reputation for tight pricing but they don’t currently offer trading on many smaller stocks outside the FTSE 100. Likewise, if you want to trade with tax free profits, Saxo Markets do not offer spread betting, so if you want to bet on the FTSE rather than trade it they won’t be for you.
You can compare brokers and decide which one is the best fit for you by using our comparison tables, either through a general trading account, CFD trading platform or Spread betting broker or if you are interested in investing in a FTSE 100 tracker through ETFs.
Trading on the FTSE 100 has always been one of the most popular markets because of constant, 24-hour movement, economic news as well as good liquidity. The UKX also has a smaller tick size (smallest movement), particularly when compared to other European indices such as the Dax – £5 per point versus €25 per point respectively.
Best FTSE 100 Platform For Futures & Options
We currently rank Saxo Markets as the best broker for trading FTSE futures based on price, market access and our broker matrix.
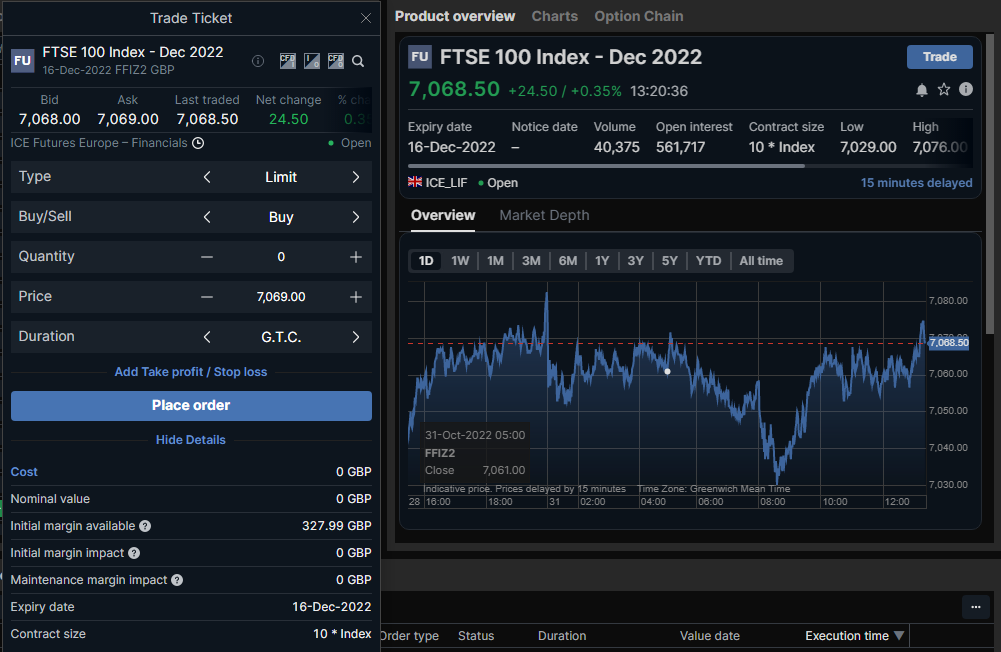
Futures contracts are derivatives that allow traders to speculate on the future price of a given commodity or instrument; in this case, the future value of the FTSE100 index.
The FTSE 100 futures contracts trade on a quarterly expiry cycle of December, March, June and September. Each of these contracts reflects the market’s expectations for the value of the FTSE100 index at that future point in time. As a contract month expires, so another is added into the cycle.
As is common to many financial futures contracts, the FTSE 100 futures are cash-settled. Meaning buyers and sellers of the contract pay or receive money based on the outcome of their trade. Without the need for delivery of the stocks that make up the index.
All trades are cleared and settled through a central clearing house which becomes the counterparty to those trades. Trades are placed on a margin basis with an initial margin or deposit required at the outset of the trade and variation or maintenance margin provided as needed through the trades lifetime.
Best FTSE 100 Trading Platform For CFDs
We currently rank IG as the best trading platform for the FTSE 100, as they offer free UKX trading signals and lots of constantly updated news and analysis.
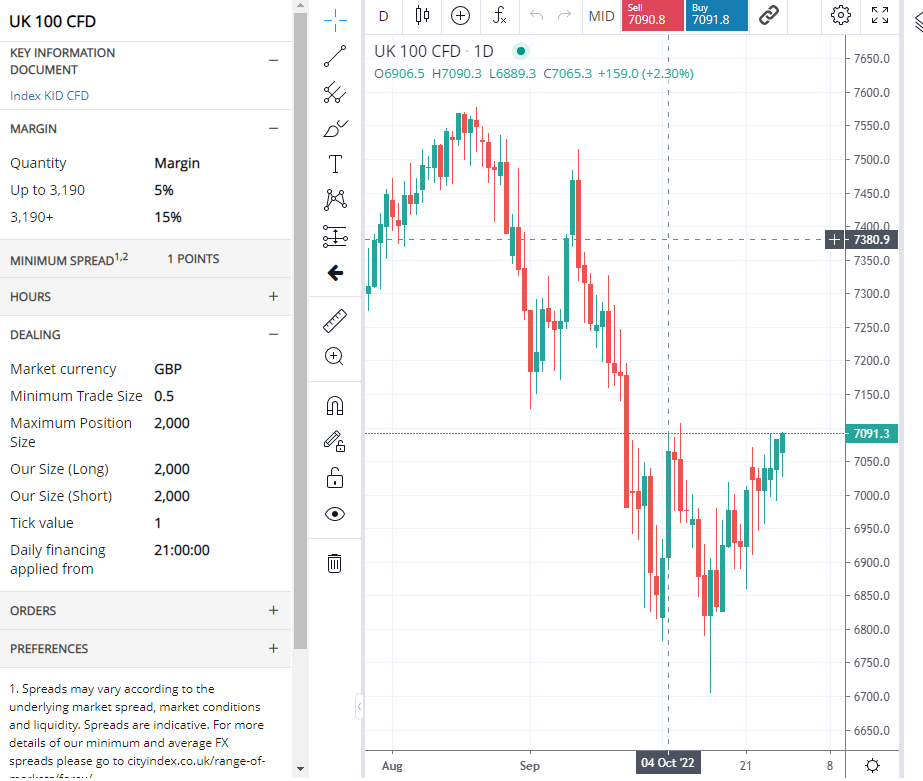
All cash-settled financial and commodity contracts are in effect CFDs or Contracts For Differences. In which, the counterparties to a trade (the buyer and the seller) pay or receive money, at the settlement of their trade, rather than making or taking delivery of the underlying instruments.
A CFD on the FTSE 100 is no exception, such contracts closely resemble the futures contracts described above, but there are some key differences.
Firstly FTSE 100 CFDs trade OTC or Over The Counter and not on a dedicated exchange.
Nor are they centrally cleared which means that the counterparties to a trade are the customer and their CFD provider.
CFDs do not have a fixed expiry date and are not subject to fixed contract sizes.
The FTSE 100 futures contract size is £10.00 per index point. Such that when the index is valued at 7000 points, the futures contract value is £70,000.
However, CFD traders can typically deal in much smaller sizes, for example, at £1 per point, or a tenth of the value of the futures contract.
Best FTSE 100 Trading Platform For Spread Betting
We currently rank IG as the largest and best broker for spread betting on the FTSE 100.
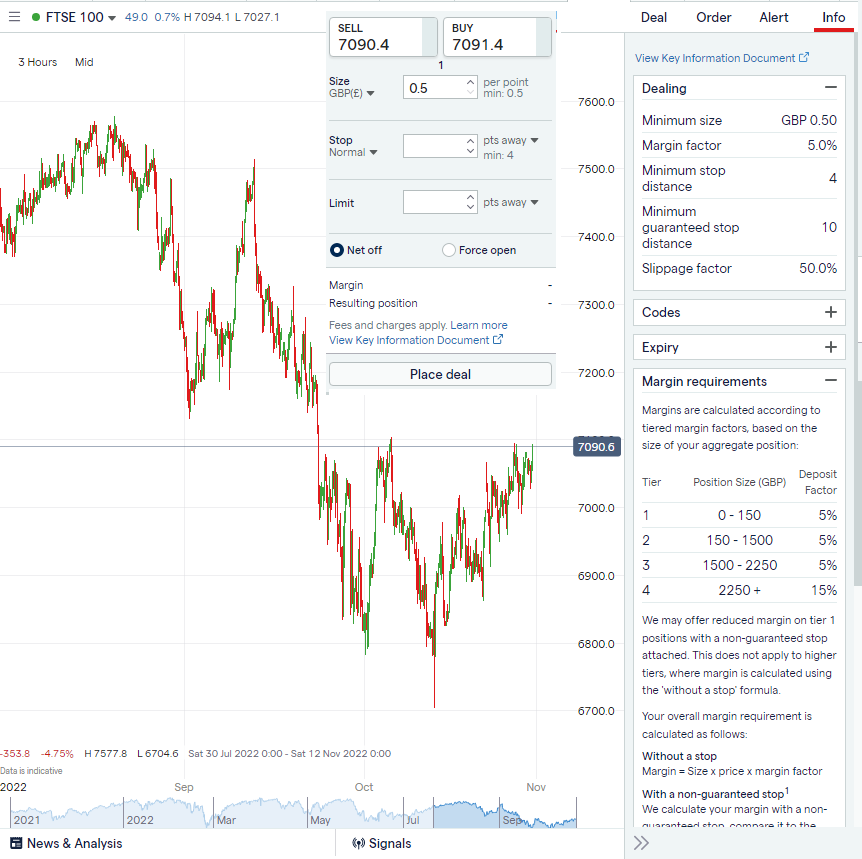
A FTSE 100 spread bet is very similar to both the futures contract and the FTSE 100 CFD. There is one key difference though, and that is that the deal is structured as a bet and not a trade.
Spread bettors trade in pounds or pennies per point and bet on the rise or fall of the FTSE 100 index. Their bookmaker is the counterparty to their bet.
Brokers offer a range of bet durations, for example, daily, monthly or quarterly bets. Perhaps the most significant difference between a spread bet on the FTSE 100 and CFD trade on the index is the tax treatment of any profits made.
Under current UK legislation profits made from betting by individual UK taxpayers are not subject to tax. However, losses arising from betting cannot be offset against capital gains made elsewhere. Profits resulting from CFD trades are subject to tax, though CFD losses can be offset.
The tax treatment of spread betting has made it very popular among retail traders. Unlike fixed-odds betting, however, your potential losses are not limited to your initial stake when you spread bet.
Best FTSE 100 Platform For ETFs
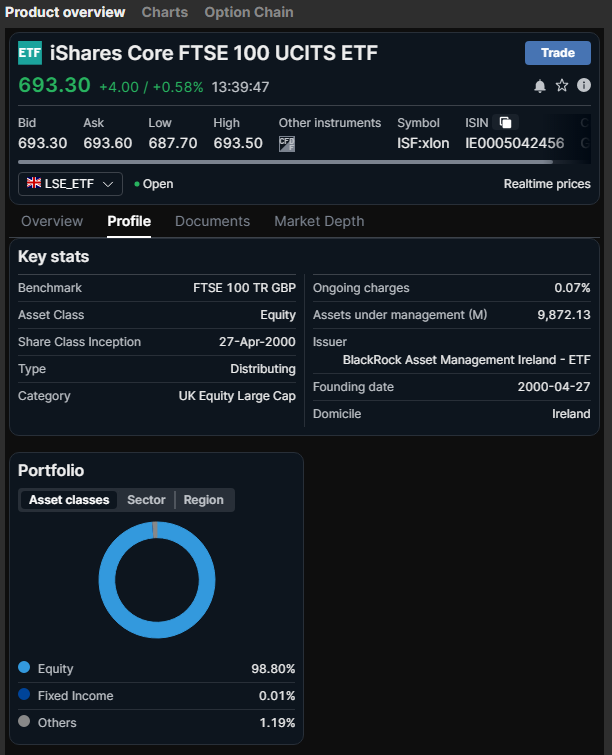
We currently rank Saxo Markets as the best broker for trading FTSE 100 ETFs as they offer DMA CFDs for on-exchange short-term trading as well as investment accounts for long-term investing.
Find a broker for investing in ETFs here
ETFs or Exchange Traded Funds are simply open-ended funds that aim to replicate the performance of a given index, sector or investment style.
For the most part, ETFs offer what is known as passive investing that is they aim to track a particular benchmark rather than outperform it. ETFs are tradeable in the same way that individual shares are.
As such ETFs offer a low-cost way for investors to replicate index or sector performance, and they allow traders to quickly gain exposure to groups of stocks or market themes.
The ETFs, which track the FTSE 100, aim to mirror its performance and will typically own a basket of FTSE 100 shares or derivative contracts over the same or similar stocks to do so.
Investors and traders who are bullish of the index buy an ETF while those who are bearish of the FTSE would sell it. It is possible to sell short of an ETF, i.e. sell it in the hopes of repurchasing the position at a lower price for a profit, but it’s best to check the requirements for doing so with your broker before proceeding.
There are more than half a dozen ETFs that track the FTSE 100 index, though the iShares FTSE 100 ETF (ticker ISF) is probably the best-known and most widely followed among them. Here is a list of some of the most popular ETFs that track the FTSE:
- HSBC FTSE 100 UCITS ETF
- Invesco FTSE 100 UCITS ETF
- iShares Core FTSE 100 UCITS ETF
- iShares Core FTSE 100 UCITS ETF
- Lyxor FTSE 100 UCITS ETF
- Lyxor FTSE 100 UCITS ETF
- UBS ETF (LU) FTSE 100 UCITS ETF (GBP)
- Vanguard FTSE 100 UCITS ETF (GBP) Accumulating
- Vanguard FTSE 100 UCITS ETF Distributing
- Xtrackers FTSE 100 UCITS ETF
- Xtrackers FTSE 100 UCITS ETF Income
How to trade the FTSE 100:
There are multiple financial products derived from the underlying FTSE 100 Index that you can trade with, including:
- Index Futures (formerly LIFFE, now at ICE) through a futures broker
- Options (ICE) – through an options trading platform
- ETFs – through an Exchange-Traded Fund investment account
- Investment Funds – through a fund investment platform
- Spread betting – through a spread betting broker
- Contracts for difference – through a CFD broker
Advantages of trading the FTSE 100
FTSE stock Indices (100 and FTSE 250) are closely watched. The index is attractive to investors and traders alike because:
- International – FTSE 100 stocks are highly international and these companies derive their earnings globally
- Liquidity – FTSE 100 has good trading volumes – as some of the FTSE stocks are huge (e.g. HSBC, BP, and GSK)
- Income – FTSE 100 pays relatively good dividend yields compared to the UK bond yields
Disadvantages of trading the FTSE 100
- Volatile – indices move around a lot
- Risky – it is hard to predict if the UKX index will rise or fall
- Leverage – if you are trading on margin trading losses are multiplied.
What drives the FTSE 100?
Stock markets are often driven by a wide variety of factors.
For the UK market, the number one factor is obviously Brexit. However, bear in mind that many FTSE 100 stocks are globalised. Brexit is one only factor impacting their businesses. The primary and instant impact that Brexit can hit FTSE 100 stocks is through the Sterling exchange rate.
Other important factors include:
- Macro factors (e.g. GDP, unemployment, business indicators etc)
- Monetary factors (e.g., Quantitative Easing, rates movements, yield curve etc)
- Technical factors (e.g., new highs or lows)
- Earnings factors (e.g., profitability and earnings momentum)
Another important factor to watch for is commodity prices. Why? Because the FTSE 100 Index has large mining and energy sectors. BP, Royal Dutch Shell, BHP, Rio Tinto, Anglo American, and Glencore are some of the largest energy and mining groups in the world. And they are all in the FTSE 100 index.
Seven-Point Guide on Trading the FTSE 100
To trade the FTSE 100 profitably requires a good trading strategy. The following tips may help you to maximise your chances of trading the FTSE 100 successfully over the long term.
- Understand your requirements for trading the FTSE 100. Are you an intra-day or positional trader? Do you invest for the long term? Are dividends important?
- Research various technical (or fundamental) indicators to support the trading objective. There are many technical indicators that you can use, including
- Trend indicators like moving average
- Oscillators
- Support & resistance levels (Guide to Support/Resistance)
- Patterns like breakout and reversals
- Backtest these indicators if they are profitable over time. Select a few that you can understand. Check their pitfalls and signal variations over time. Put these indicators into a trading software and backtest. Can you withstand the drawdown?
- Select the indicators that best suit the objective. Once the initial backtest research is completed, setup a mock testing period of, say, six weeks. Assess the results. Are they good? Which type of indicators works better?
- Include risk management factors in your assessment. Important factors like position sizing, leverage levels, stop loss levels and risk-reward ratios must be specified. Trading without risk management is like driving without brakes and safety belts.
- Select trading platforms that support your operations. Capital requirements, platform fees, and trading capability are all important factors to look for. See the comparison table above.
- Commit capital and go live. Make sure that you drip feed capital into new strategies because there may be many things to iron out before you’re comfortable with it.
FTSE 100 trading tips and strategy:
To trade the FTSE 100 profitably requires a good trading strategy. The following tips may help you to maximise your chances of trading the FTSE 100 successfully over the long term.
- Understand your requirements for trading the FTSE 100. Are you an intra-day or positional trader? Do you invest for the long term? Are dividends important?
- Research various technical (or fundamental) indicators to support the trading objective. There are many technical indicators that you can use, including
- Trend indicators like moving average
- Oscillators
- Support & resistance levels
- Patterns like breakout and reversals
- Backtest these indicators if they are profitable over time. Select a few that you can understand. Check their pitfalls and signal variations over time. Put these indicators into some trading software and backtest. Can you withstand the drawdown?
- Select the indicators that best suit the objective. Once the initial backtest research is completed, setup a mock testing period of, say, six weeks. Assess the results. Are they good? Which type of indicators works better?
- Include risk management factors in your assessment. Important factors like position sizing, leverage levels, stop loss levels and risk-reward ratios must be specified. Trading without risk management is like driving without brakes and safety belts.
- Select trading platforms that support your operations. Capital requirements, platform fees, and trading capability are all important factors to look for. See the comparison table above.
- Commit capital and go live. Make sure that you drip-feed capital into new strategies because there may be many things to iron out before you’re comfortable with it.
Alternative indices to UK FTSE 100 (FTSE 100) trading
You can read about the major indices in our guide to the best indices for index trading.
How to invest in the FTSE 100?
The easiest way to invest in the FTSE 100 is to buy an ETF that tracks the index or invest in the FTSE 100 you can either buy an ETF or a derivative contract based on the indices value. In this guide, we will explain what the FTSE 100 index is, and the pros and cons of the different ways to invest in it.
Advantages of investing in the FTSE 100
The index attracts international institutional investors due to how representative the index is of some industries. In particular, the pros of investing in the FTSE 100 are:
- Size – FTSE 100 is one of the largest and most liquid stock indices in the world
- International – representation of the constituents; many derived their earnings globally
- Maturity – of the UK economy
- Good Dividend Yield – as many stocks operate in industries that are mature
Last I checked, the overall dividend yield on the FTSE 100 index is a good 3.92%. Not bad compared to other equity markets. If you are a novice investor in the UK, the FTSE 100 Index will be one of the first areas to research.
Disadvantages of buying the FTSE 100
However, there are some drawbacks of investing in the FTSE 100 as well. The cons include:
- Lack of technology companies – which is a big turn-off for many growth investors
- Low growth – of the British economy, due to a variety of factors
- Unexciting valuation – of many UK companies
On the third point, look no further than ARM (NASDAQ: ARM). Formerly a heavyweight tech darling in the LSE, it was bought out by SoftBank a few years back. This month, it was relisted. The venue? No other than Nasdaq. The LSE just proved itself unable to hold on to any big tech.
In sum, when investing in the FTSE 100 index you need to be realistic about its future returns. While it may not be the most exciting index, it proves to be a more stable aggregation and, with dividends, are more suited for long-term value investors.
Where to invest in the FTSE 100?
Should you decide to invest in this large-cap index, how should you go about doing it?
There are a few ways to gain exposure to this particular sector. Most choose funds that hold these hundred shares in a portfolio.
FTSE 100 ETFs
Major funds that hold UK large-cap shares include:
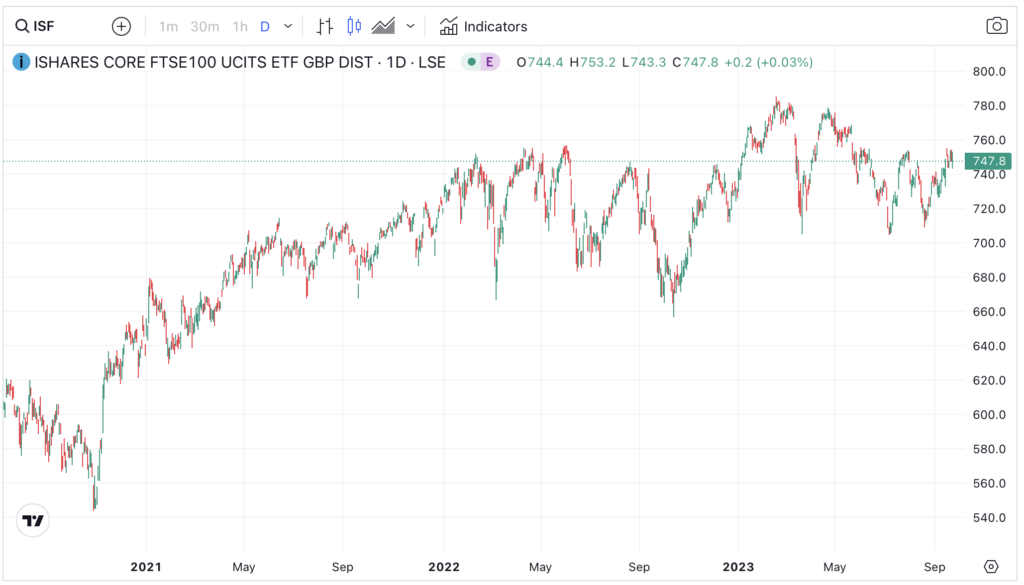
- iShares FTSE 100 ETF (ticker: ISF, factsheet here)
- Vanguard FTSE 100 (ticker: VUKE, factsheet here)
What differentiates the above two ETFs from the rest is they are the most popular and have the most assets under management. ISF is a £11 billion ETF while VUKE has £4.7 billion AUM. Capital flow to the most liquid instruments.
If you’re a beginner investors, sticking to the largest is often a better strategy. You can buy these low-cost ETF in your ISA account with minimal transaction frictions. Remember, capital gains with ISAs are tax efficient.
Another point worth noting is that ISF is a ‘distributing’ ETF, meaning dividends from the portfolio are passed to shareholders. There is a ‘accumulating’ version whereby dividends are accumulated in the ETFs (iShares FTSE 100 ETF, ticker: CUKX). Its AUM is smaller at £1.8 billion (factsheet).
FTSE 100 Derivatives
If you are more interested in trading the FTSE 100 in the short term, there are other ways to buy the index, although these are more risky because they entails leverage:
- FTSE 100 futures contracts – you are buying a fixed amount of the FTSE index for a set date in the future
- FTSE 100 options contracts – you buy the right (but not the obligation) to buy a set amount of FTSE futures at a set date in the future.
- FTSE 100 spread bets & CFDs – you can speculate on the price of the FTSE 100 index going up or down.
Related guide: What is the FTSE 100 index?
5 FTSE ETFs and what they cost to invest in
FTSE ETFs are a fund that tracks the FTSE index that you can buy as easily as buying normal shares, by investing in all the constituents of the FTSE 100. One of the main differences (and key costs though) is that there is an ongoing management charge as even though they are passive investments, they still have to be actively managed to ensure accurate tracking.
Best FTSE ETFs Compared
| FTSE ETFs | Price (p) | Size | Fee | Spread |
| iShares Core FTSE 100 UCITS ETF GBP Dist. (LON:ISF) | 730.50 | £11.2bn | 0.07% | 0.03% |
| Invesco FTSE 100 UCITS ETF GBP Acc. (LON:S100) | 7,558.36 | £16bn | 0.09% | 0.05% |
| HSBC FTSE 100 UCITS ETF (LON:HUKX) | 7,467.00 | £479bn | 0.07% | 0.08% |
| Vanguard FTSE 100 UCITS ETF GBP Acc. (LON:VUKG) | 36.47 | £4.8bn | 0.09% | 0.25% |
| Xtrackers FTSE 100 UCITS ETF (LON:XDUK) | 1,099.00 | £49m | 0.09% | 0.07% |
iShares Core FTSE 100 UCITS ETF GBP Dist. (LON:ISF)
- Annual management fee: 0.07%
- Fund size: Approximately £11.2 billion, offering high liquidity.
- Accessibility: It’s known for having the lowest market price among FTSE 100 ETFs, making it highly tradable.
Invesco FTSE 100 UCITS ETF GBP Acc. (LON:S100)
- Annual management fee: 0.09%
- Fund size: Approximately £16 billion, the largest asset size among FTSE 100 ETFs.
- Performance: Recognized as the best-performing major FTSE 100 ETF in 2023.
HSBC FTSE 100 UCITS ETF (LON:HUKX)
- Annual management fee: 0.07%
- Fund size: Approximately £479 million, providing the least tracking error.
- Dividend yield: Around 4%, offering a competitive return.
Vanguard FTSE 100 UCITS ETF GBP Acc. (LON:VUKG)
- Annual management fee: 0.09%
- Fund size: Approximately £4.8 billion, managed by a reputable brand.
- Dividends: Reinvested, which could benefit passive investors seeking compound growth.
Xtrackers FTSE 100 UCITS ETF (LON:XDUK)
- Annual management fee: 0.09%
- Performance: Best performance over the past five years among FTSE 100 ETFs.
- Tax efficiency: Based in Luxembourg, known for favorable tax conditions which may enhance returns.
Where can you trade FTSE 100 options to hedge UK shares?
There are effectively two choices when it comes to trading options you can opt for exchange-traded options or you can choose to trade CFDs/spreadbets over those options or their OTC equivalents. In this guide, we will explain what FTSE 100 options are, how you can trade them, and what hedging the FTSE 100 with options is.
A reader asked:
I would like to trade FTSE 100 index options. I would also like to hedge UK shares with options. Which broker/brokers do you recommend and why?
FTSE Options (on-exchange)
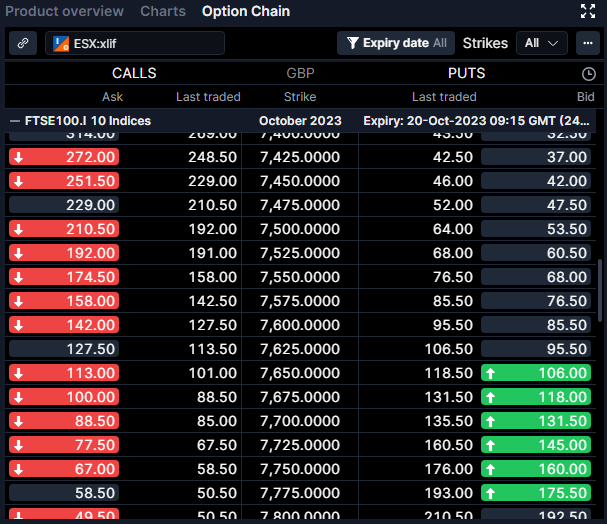
FTSE options give you the right (but not the obligation) of a set amount of FTSE 100 futures at a set date in the future. They are a good way of either speculating on the FTSE 100 either moving a lot or not at all. We go in to more detail on who options work in our how-to trade options guide, but for now we shall focus on the specifics of the FTSE.
When you buy FTSE 100 options you will be presented with an options chain window, like this one on Saxo Market’s platform. Saxo offers direct market access and a very robust trading platform.
FTSE 100 CFD/Spread Bet Options
Because options on the FTSE 100 are cash-settled and not deliverable, that is they are a CFD themselves, in this instance, there isn’t that much difference between the two.
The key advantage of FTSE 100 CFD options is that you can trade in smaller size, as an on-exchange FTSE 100 option contract size traded on ICE is £10 per index point. So CFDs give you more flexibility over the size of your position.
However, the same is true of spread betting on options and you get the added advantage of your profits being tax-free (as trades are structured as a bet). So if you are buying FTSE 100 options to hedge your portfolio exposure to reduce the amount of tax you pay by not selling your shares to realise capital gains. If the market drops and you have bought FTSE 100 put options as a spread bet, you won’t pay tax on the profits from your hedge.
IG offer quite a comprehensive FTSE options chain for spread betting. Unlike other brokers who offer FTSE 100 OTC options, they call them FTSE rather than UKX, suggesting that they have invested in the official licence to use the FTSE trademark.
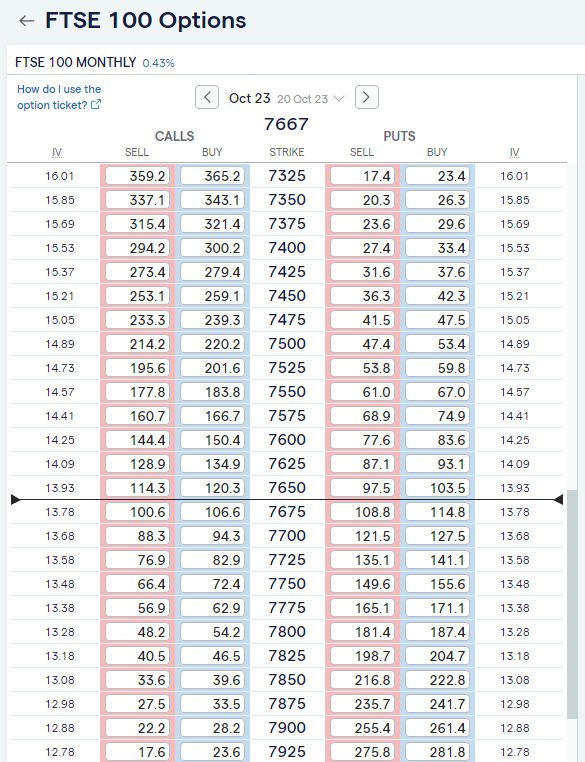
If you go down the exchange-traded route the counterparty risk is between you, your broker and the options clearinghouse. Whereas, of course, if you go down the CFD route your counterparty will be the CFD broker.
- Related guide: Compare FTSE 100 trading platforms.
However, in the event of failure, retail client monies are covered up to a value of £85,000 by the Financial Services Compensation Scheme or FSCS.
Hedging Shares With FTSE 100 Options
In terms of hedging physical shareholdings, if you are just looking for an equal and opposite offset against a drop in the monetary value of your share portfolio, in say a market downturn, then CFDs on options would likely work for you as well.
The outright logistics of putting on a hedge will be determined by the composition of your portfolio, which probably won’t match a particular index exactly. Nor will it be valued at a nice round amount. If that’s the case then hedging with options won’t be a perfect fit but with a little work, you should get to a very close approximation.
Being able to deal in fractions of an options lot may be of assistance here, that’s an advantage that CFDs on options have over their exchange-traded counterparts.
- Related guide: How to invest in the FTSE 100?
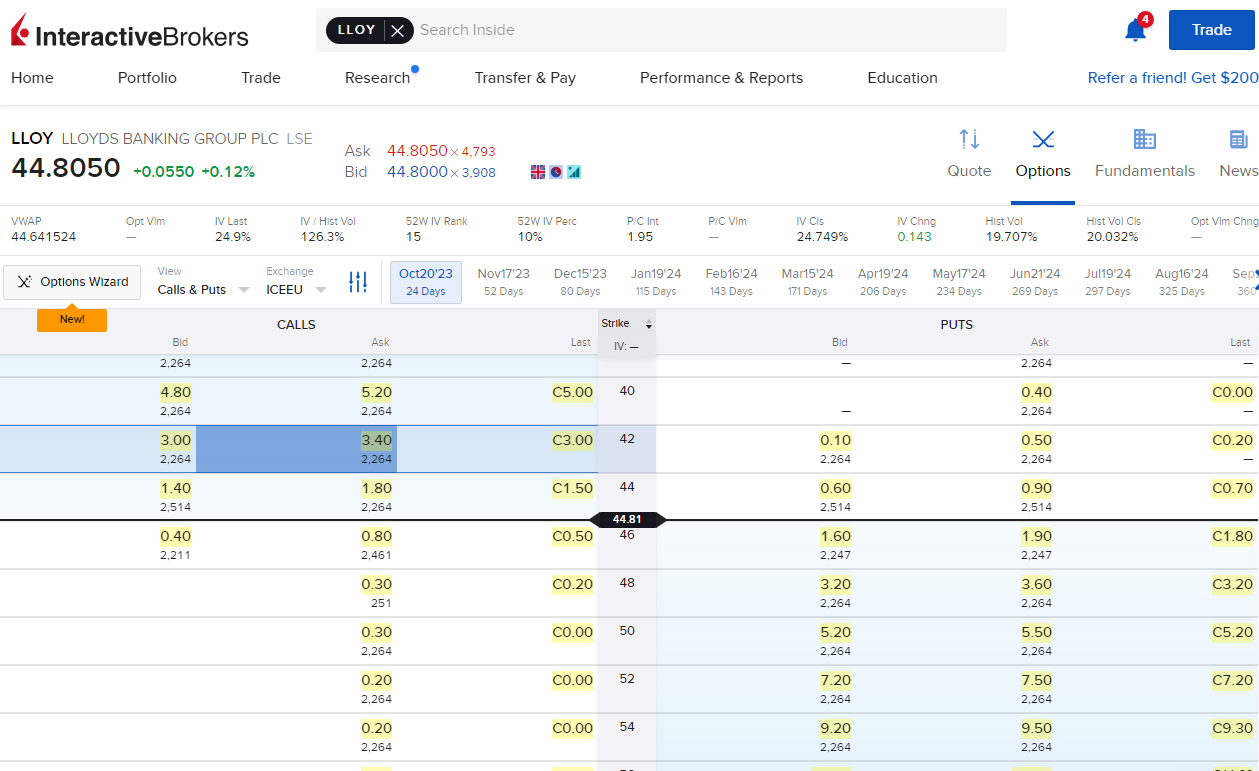
One of the cheapest and best platforms for trading single stock options is Interactive Brokers, which offer an easy to use web-based platform, and an extremely advanced desktop options trading platform for more experienced options traders. You can see an example of their options chain on Lloyds bank shares.
FTSE 100 Index Options Expiry
Don’t forget however that options have a finite lifetime and as such an options hedge won’t last forever, and may need to be periodically renewed or rolled which may incur additional costs.
Values of the FTSE 100 index options are calculated at 10:15am (GMT) on the date of expiration.
Exercise windows are between 18:10 – 18:40 London time on the last trading day.*
As to which brokers you should use, without knowing more about your circumstances, it’s not possible to say but why not have a look at our Compare Options Brokers in the UK page which will provide you with the information you need to make a choice.
Here are our tips on trading with historical data.
We have had quite a bit of interest in options trading recently and we don’t always publish Q&As that are very similar but we like to answer every question with a specific response and publish those that we think will help our users.
- Related guide: What is the FTSE 100 index?
FTSE 100 Constituents & Performance
The table below lists the constituents of the FTSE 100 Index (UKX). You can rank the top UK100 companies in the index by name, market cap, price-earnings ratio and earnings per share. You can also rank these FTSE 100 companies by our rating and click through to see our full analysis and outlook.
List of companies in the FTSE 100 (UK100/UKX) Index
What time does the FTSE 100 close?
The FTSE 100 stock market index in the United Kingdom typically closes at 4:30 PM (16:30) London time (GMT/BST). However, it is possible to still trade the FTSE 100 when the main index is closed. In this guide, we will explain more about what happens when the FTSE 100 closes and how you can trade it.
FTSE 100 closing times around the world
The FTSE 100 closes at:
- 4:30 pm London time
- 11:30 am New York time
- 5:30 pm Paris time
- 23:30 pm Hong Kong time
- 01:30 am Sydney time
Related guide: What is the FTSE 100 index?
FTSE 100 closing auction
At the end of the FTSE 100 trading day on the London Stock Exchange (LSE) there is an end-of-day auction is known as the “Closing Auction” or “Closing Price Crossing Session.” This is designed to determine the closing price of the FTSE 100 index. It is also used for clients to execute MOC orders (market on close). There is often significantly more volume in the closing auction that throughout quite periods of the day, and it is a good session for larger orders to be matched.
During the Closing Auction, orders to buy and sell FTSE 100 constituent stocks are matched, and the prices at which these orders are matched help establish the official closing prices for those stocks. The closing price of each stock then contributes to the calculation of the FTSE 100 index’s closing level.
The closing prices determined during this auction are crucial for various market participants, including index funds and ETFs that track the FTSE 100, as they rely on the official closing level to value their portfolios accurately.
- Related guide: How to invest in the FTSE 100?
Days when the FTSE 100 is closed
The FTSE 100 follows the same general trading calendar as the London Stock Exchange (LSE). The LSE is typically closed on the following days in the United Kingdom:
- Weekends: The FTSE 100 is closed on Saturdays and Sundays. However, you can trade the UKX with an CFD of spread betting brokers like IG that offers weekend markets.
- Bank Holidays: The FTSE 100 index does not trade on public holidays in the UK, when the LSE is closed. These holidays may include New Year’s Day, Good Friday, Easter Monday, Early May Bank Holiday, Spring Bank Holiday, Summer Bank Holiday, and Christmas Day, among others. The specific holidays may vary from year to year.
- Christmas and New Year Period: The FTSE 100 usually has reduced trading hours on Christmas Eve and New Year’s Eve and is closed on Christmas Day and New Year’s Day.
Can you trade the FTSE 100 when the main markets are closed?
It is possible to trade the FTSE 100 even when the main market is closed through CFDs, financial spread betting and futures or options. Futures and options contracts for the FTSE 100 allow traders to speculate on the future price movements of the index even when the underlying cash market is closed. These derivatives are traded on futures and options exchanges and have their own trading hours, which can extend beyond the regular trading hours of the cash market.
If you are trading the FTSE outside of normal market hours there are a two things to be aware of
- Liquidity: There will be less volume traded, so it will be harder to execute larger orders.
- Volatility: Because of reduced volume, large orders will have a greater effect on price and move the market more.
Is there a ‘best day’ to buy into the FTSE 100 Index?
We study the distribution of annual peaks and bottoms of the blue-chip FTSE 100 index and find prices show positive momentum into the year-end. Trading day #249 (5th September) of each year rallies 80% of the time and maybe the best time to buy the FTSE.
Over the last 36 years (1984-2020), the FTSE 100 Index of leading UK companies rose about 5.2 times, from 1,000 to 6,240. At a glance, this return – excluding dividends – seem significant. But a quick calculation of its corresponding Compound Annual Growth Rate (CAGR) yields a more respectable return over the three and a half decade – at 5.16%. (Read here on CAGR)
It is a good – but not a great return. And it is easy to see why. Looking at FTSE’s chart, today’s figure of 6,240 is no higher than it was back in 2000, twenty years ago. Arguably, the exclusion of dividends lowers the final return for investors. However, bear in mind that few investors can afford to compound these dividends over such a long time. Investors tend to be impatient.
No wonder many investors are unhappy with the ‘buy and hold’ strategy. They want to squeeze more returns out of the UK stock market. They buy into growth stocks. They stampede into ‘fads’. And they use market timing. Every edge is to be utilised. ‘Is there a good day,’ investors often wonder, ‘to buy stocks every year?’
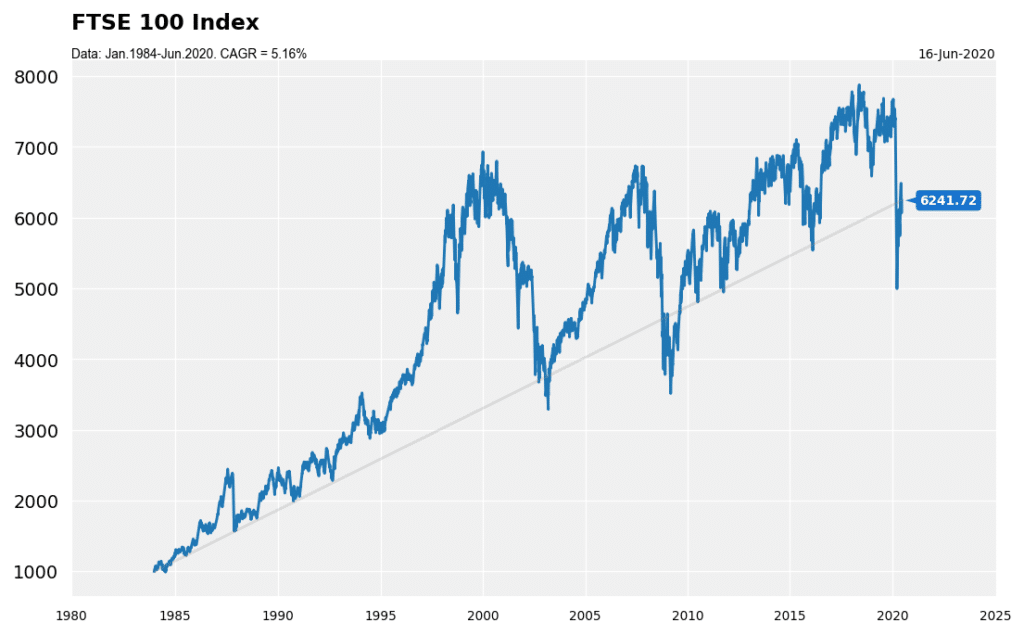
The distribution of peaks and troughs of FTSE 100
To answer this question the first step is to look at past annual peaks and troughs.
To this end, we splice the FTSE 100 index by year and rebase the data to zero the start of each year. This new dataset is then plotted below. Each grey line represents one calendar year. All are grey except for the last two years. The red line is the rebased series from 2019, while the blue line is the current year.
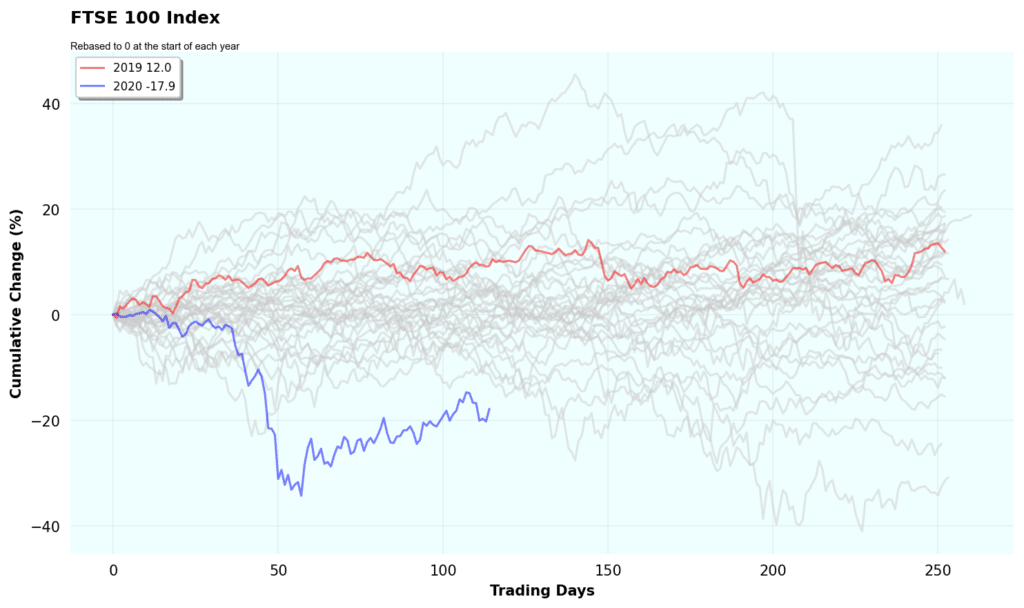
Just looking at this chart, 2020 is shaping up to be a very unusual year.
Share prices collapsed in March when the country lumbered into a total societal lockdown caused by the coronavirus pandemic. Seldom has the index fallen so far, so early in the year. Down 35% after only 55 days of trading, and after 100 days of trading, the index is still trading at a level far below previous years at the same period.
Next, we look at the peak and trough of each rebased series. I marked the peak of each rebased data on the chart as a green dot and the bottom as a red dot. Some interesting patterns emerged on this chart.
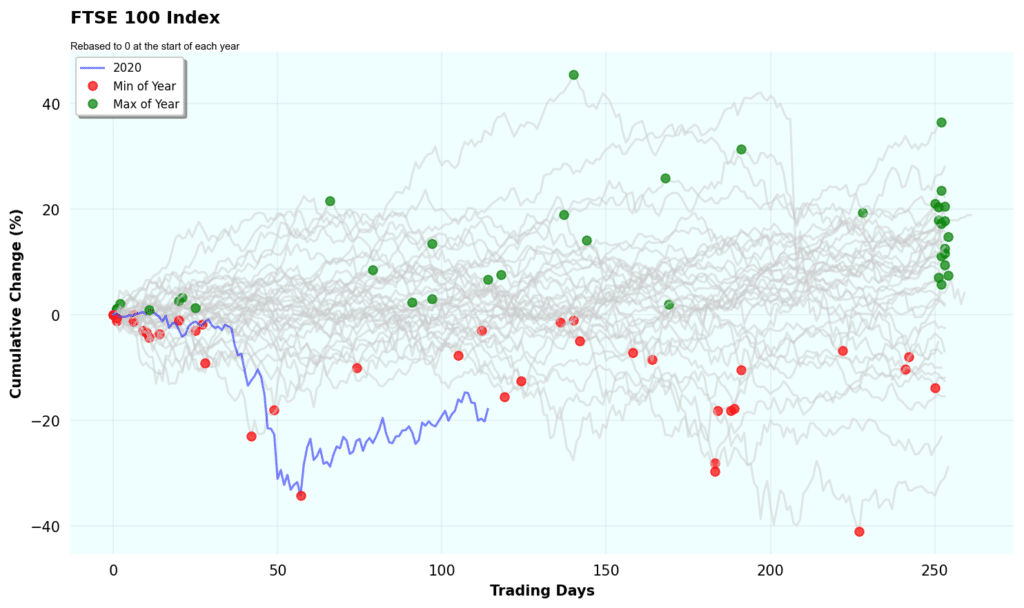
Pattern 1: There is a crowding of green dots (peaks) at the end. This means that the UK stock market habitually ends the year on the high. The ‘Santa Rally’ is real. There are some peaks scattered throughout the year. But the index tends to ramp higher into the new year.
For troughs, there are also some crowding at the beginning of the year, but the concentration is not as pronounced as the peak. The red dots, more or less, spread out throughout the year.
Pattern 2: The existence of upper and lower boundaries. Seldom did the index venture above 40% on the bull side and 40% on the down side.
Throughout the last three decades, only once did the FTSE 100 Index plunge below 40% and twice it breached the 40% barrier – and only for a brief period. This suggests that reversionary – that is, contrarian – strategies must be considered when the index trends strongly in either direction.
Armed with this info, are we closer to answering how do we buy near the lowest of the year? One possibility is to look at how the index bottomed out throughout the years.
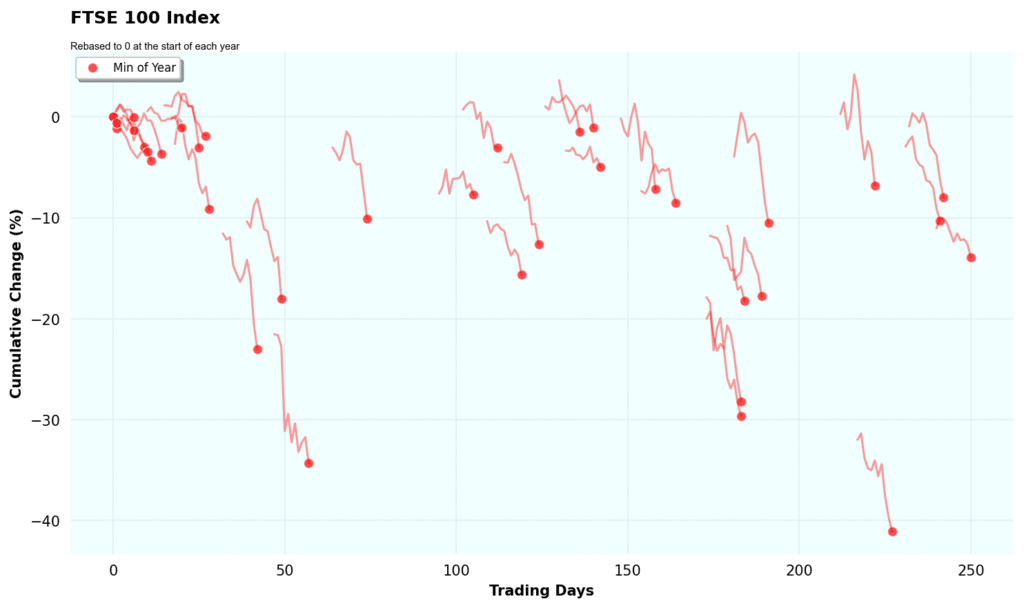
In the chart below, I extract all the bottoms of the year and its preceding 10-day trend before these lows are attained.
Pattern 3: Before bottoming out for the year, the index typically corrects about 5-10% in the preceding days. There were, however, many cases when the index dropped less than 5% before the bears were checked. These instances occurred in the early days of a trading year.
Are there some trading days in which share prices tend to go up?
Using the same data above, I aligned all the trading days together. For example, I grouped all the returns for each trading day (e.g., Day 2) from all years (1984-’20) and count the percentage where returns are positive. This is done from Day 1 to Day 258, and plotted in a bar chart below.
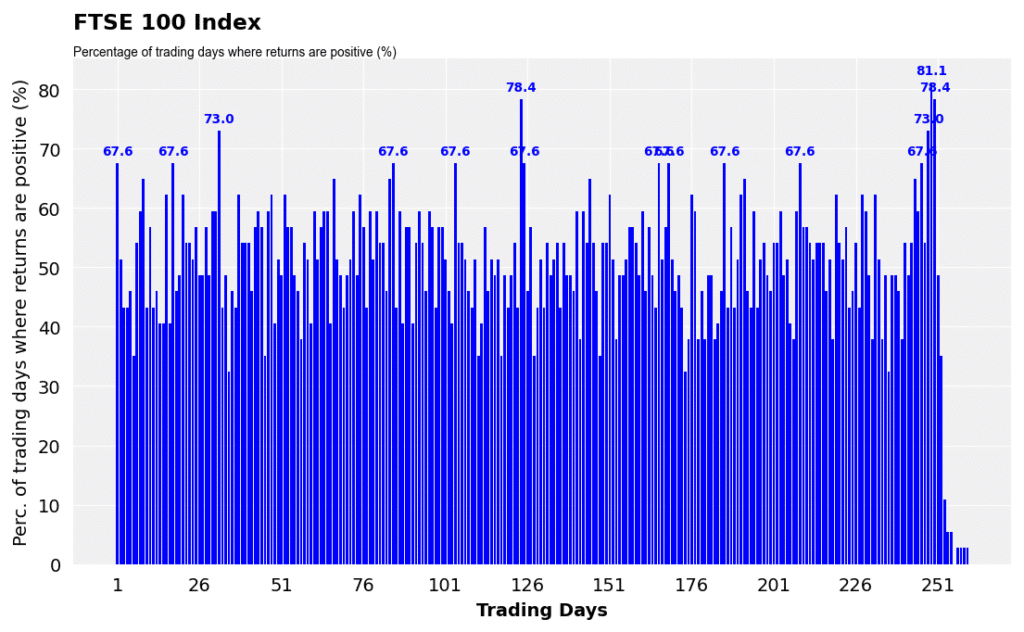
Again, the pattern we saw in Chart 3 is repeated here. The percentage of positive days generally rises into the year end. This turn-of-year effect is probably due to renewed optimism about the coming year.
This may be the best day to buy the FTSE…
Day 249 (5th September), for example, is the closest you get to a ‘buy day’- as 81% of the time the prices exhibit a positive return on that particular trading day of the year. In other words, you would want to buy on Day 248 and hold for one trading day.
There are some other days when the percentage is high, such as Day 124 of each year when the percentage hit 78.4%. But these high percentage days are seemingly quite random.
What is the FTSE All-Share Index?
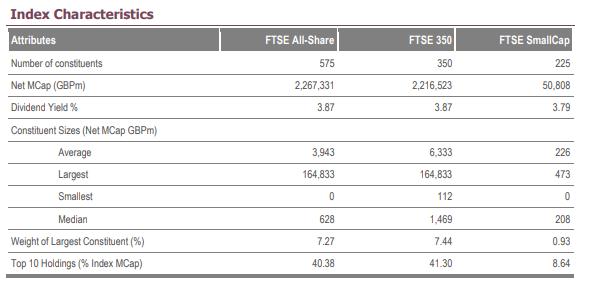
The FTSE All-Share Index, (FTSE All-Share) is a broad-based stock market index that represents the performance of 575 listed companies on the London Stock Exchange (LSE) that range in size from £3.9bn (Superdry) to £1734bn. (Shell).
It was formed in 1962 and has an aggregated market cap of £2tn, and overall produces a dividend yield of 3.85%. As it covers more companies, sectors and companies of various sizes it is considered a better guage fo the UK stock market than the FTSE 100 (Which only covered the top 100 listed companies by market cap).
Comprehensive Coverage
The FTSE All-Share includes not only the companies listed on the FTSE 100 (the largest 100 companies by market capitalization) but also the companies listed on the FTSE 250 (the next 250 largest companies) and the FTSE SmallCap Index (smaller companies). Therefore, it encompasses a wide range of companies, from large multinational corporations to smaller, domestically focused firms. You can see here how the FTSE all share compares to the other major UK indics.
- Related guide: How to invest in the FTSE 100?
Diverse Sectors
The index covers companies from various sectors, including financial services, healthcare, technology, consumer goods, energy etc.. This diversity reflects the overall composition of the UK stock market. The currency breakdown of sectors and companies within the FTSE all share is:
| Sector | # companies | % of index |
| Technology | 17 | 2.96 |
| Telecommunications | 6 | 1.04 |
| Health Care | 12 | 2.09 |
| Financials | 257 | 44.70 |
| Real Estate | 51 | 8.87 |
| Consumer Discretionary | 82 | 14.26 |
| Consumer Staples | 22 | 3.83 |
| Industrials | 85 | 14.78 |
| Basic Materials | 21 | 3.65 |
| Energy | 14 | 2.43 |
| Utilities | 8 | 1.39 |
| 575 | 100 |
FTSE All Share Constituents
Like many stock market indices, the FTSE All-Share is weighted by market capitalization. This means that larger companies have a more significant influence on the index’s movements than smaller ones.
Here are the ten largest and smallest companies listed on the FTSE-All shares:
| Biggest Companies | Largest Market cap (m) | Smallest Companies | Smallest Market cap (m) |
| SHELL PLC ORD EUR0.07 | 173,903.87 | SUPERDRY PLC ORD 5P | 38.93 |
| ASTRAZENECA PLC ORD SHS $0.25 | 164,537.10 | POD POINT GROUP HOLDINGS PLC ORD GBP0.001 | 50.24 |
| HSBC HLDGS PLC ORD $0.50 (UK REG) | 123,667.57 | NB GLOBAL MONTHLY INCOME FUND LD RED ORD SHS NPV £ | 51.53 |
| UNILEVER PLC ORD 3 1/9P | 102,546.59 | CT UK HIGH INCOME TRUST PLC ORD 0.1P | 66.66 |
| BP PLC $0.25 | 90,030.36 | VALUE AND INDEXED PROP INC TRUST ORD 10P | 83.43 |
| DIAGEO PLC ORD 28 101/108P | 71,054.57 | MOTORPOINT GROUP PLC ORD 1P | 83.88 |
| RIO TINTO PLC ORD 10P | 65,419.94 | GLOBAL OPPORTUNITIES TRUST PLC ORD 1P | 90 |
| GSK PLC ORD 31 1/4P | 61,548.10 | PALACE CAPITAL PLC ORD 10P | 93.9 |
| BRITISH AMERICAN TOBACCO PLC ORD 25P | 60,829.54 | SCHRODER EUROPEAN REIT PLC ORD GBP0.10 | 94.68 |
| GLENCORE PLC ORD USD0.01 | 57,283.16 | MAJEDIE INV PLC 10P | 96.72 |
- Related guide: How to invest for a monthly income
Performance Benchmarks
The constituents of the FTSE All-Share is reviewed regularly to ensure that it includes eligible companies. Companies may be added or removed from the index based on factors like market capitalization and liquidity.
The FTSE All-Share Index is a commonly used yardstick or benchmark. Investment professionals and analysts look at its performance to understand whether the broader UK stock market is going up or down. By comparing the performance of individual stocks or investment portfolios to the FTSE All-Share, they can assess how well those investments are doing relative to the overall market.
Investment professionals, including fund managers, use the FTSE All-Share as a basis for designing investment products like mutual funds and exchange-traded funds (ETFs). These investment products are designed to replicate the performance of the FTSE All-Share Index. In other words, they invest in the same companies in roughly the same proportions as the index. This allows investors to put their money into these funds and effectively “track” or mimic the performance of the entire UK stock market.
How can you invest or trade the FTSE All-Share Index?
The easiest way to invest in the FTSE All-Share Index is to buy an ETF that tracks it like Vanguard’s FTSE U.K. All Share Index Unit Trust or the SPDR® FTSE UK All Share UCITS ETF where the fund’s primary goal is to replicate the performance of the extensive UK equity market. To achieve this objective, the Fund’s investment strategy is focused on closely mirroring the performance of the FTSE All-Share Index while making every effort to minimize any divergence between the Fund’s performance and that of the Index.
You can also trade the index through derivatives like CFDs, financial spread betting, or futures and options.
⚠️ FCA Regulation
All FTSE trading platforms that operate in the UK must be regulated by the FCA. The FCA is the Financial Conduct Authority and is responsible for ensuring that UK FTSE 100 trading platforms are properly capitalised, treat customers fairly and have sufficient compliance systems in place. We only feature FTSE 100 trading platforms that are regulated by the FCA, where your funds are protected by the FSCS.
FTSE 100 trading FAQ:
Stock prices are driving factor of the FTSE 100 as that is what it is based on, but other important factors include:
- Macro factors (e.g. GDP, unemployment, business indicators etc)
- Monetary factors (e.g., Quantitative Easing, rates movements, yield curve etc)
- Technical factors (e.g., new highs or lows)
- Earnings factors (e.g., profitability and earnings momentum)
Another important factor to watch for is commodity prices, as the FTSE 100 Index has large mining and energy sector exposure from shares like; BP, Royal Dutch Shell, BHP, Rio Tinto, Anglo American, and Glencore which are some of the largest energy and mining groups in the world.
The FTSE 100 Index is capitalisation weighted, meaning that larger stocks have a larger impact on the index movements. Formed in 1984, the index is currently maintained by the FTSE Group. The index is calculated throughout a trading session regularly.
FTSE index futures usually expire in March, June, September, and December.
The biggest ETF based on the FTSE 100 Index is the FTSE 100 ETF (ticker: ISF). This ETF is gaining popularity because of the ease of trading, unlike futures or options where there are rollover costs and expiry dates.
On a historical basis, the FTSE 100 is not a particularly volatile index with its mean 30-day volatility. since the year 2000 coming in at 21.5% on a scale of 0 to 100, according to data from FTSE Russell who manage the index. It offers some of the best liquidity for UKX trading.
Prices within standard UK market hours will typically be tighter and will see more activity than those made out of hours. As a rule of thumb the farther you are away from the home session then, the wider the prices are likely to be.
The FTSE 100 index itself is calculated daily in real-time from the opening auction at 08.00 am in London until the closing auction at 16.35pm, Monday to Friday, excepting UK Bank Holidays.
However, FTSE 100 futures are traded in London over a much longer period, which runs between 01.00 am to 9.00 pm. What’s more many CFD and spread betting providers offer prices in the FTSE 100 24 hours per day, five days a week.
You can find expert advisors through MT4 brokers with automated UKX trading strategies. However, trading systems are only as good as the rules that govern them and given the number of variables in play on any given trading day, it’s unlikely that anyone system will be effective all of the time. After all, even the most advanced quantitative hedge funds find it difficult to make money consistently in the current climate.
The term FTSE 100 is trademarked and brokers must pay a licence fee to use the index name. To avoid these license fees, brokers have created their own index based on the underlying price of the FTSE 100 and called it the UKX.
Swing trading is a trading style that aims to identify the beginning or end of trends within the price action of an index or instrument; in this case, the FTSE 100 index or derivatives thereof.
ETFs are becoming increasingly popular among investors who wish to take a longer-term view on a particular index or sector. That’s because ETFs offer a low cost, efficient way to gain market exposure. Moreover, as we noted earlier an index tracking ETF such as ISF (the IShares FTSE 100 ETF) only tries to mirror the performance of the underlying index rather than outperform it, which is much harder to achieve.
Investors can hold ETFs on the FTSE 100 within stocks and shares ISAs and self-invested pension plans or SIPPS as they are known. However, as with any investment strategy, it’s important to assess your risk concentration and individual requirements in terms of income versus capital growth and to seek professional advice.

Richard Berry
This article contains affiliate links which may earn us some form of income if you go on to open an account. However, if you would rather visit the FTSE trading platforms via a non-affiliate link, you can view their UKX/UK100 trading pages directly here:


