In this guide to pairs trading, we explain how you can potentially profit from trading two stocks or markets against each other whilst remaining relatively protected from overall market movements.
- Pairs trading benefits from a simultaneous rise and fall in two instruments
- Convergence is betting on two securities moving closer; divergence is that two instruments widen
- An example of IG vs CMC Markets is used to show how pairs trading can be initiated
What is pairs trading?
Pairs trading is a non-directional strategy that speculates on the price movements between two instruments. The key here is the relative movements between the two sets of prices.
Pairs trading is a sophisticated trading strategy because it requires skills that are different to long-only investing. Statistical knowledge, quantitative backtesting, technical analysis and/or fundamental know-how are all needed to some extent to create and manage a successful pairs trading strategy.
Knowledge about short-selling is also required. This is because the strategy involves buying one stock and shorting another.
- Related guide: 50 rules for successful trading
When trading on the differential movement of two securities, you either speculate that they will narrow (convergence) or wide (divergence). The trick is to trade at the right time. The reason is that the disparity in value may sometimes widen further – outside historical boundaries – causing losses to the pair trade.
How does pairs trading work?
One frequently used pairs trade entails buying an ‘undervalued’ stock and selling an ‘overvalued’ one.
The premise is that the undervalued security will appreciate over time – and the overvalued one will fall. This reversionary price move could be independent to the general market direction. Hence the term ‘market neutral‘.
One appeal of a long-short trading strategy is that the returns are independent to that of market benchmarks, given that the strategy does not rely exclusively on buying benchmark members. Hedge funds that employ pairs trade often boast of making money in all market conditions.
The broad framework for discovering and executing a pairs trade involves the following steps:
- Identify the market to execute the pair trading strategy
- Formulate the selection criteria – eg, market cap > $100 million, sectors, liquidity, shorting
- Overlay with other filters including technical, fundamental, or statistical – eg profitability ratios or moving averages
- Capital employ into the strategy – eg, leverage, position size,
- Trade execution – eg manual or auto, pre-set filters, entry prices, duration
- Trade management – eg, risk tolerance and monitoring
- Exiting the trade – eg hitting stop loss or profit targets or time duration
The success of a pair trading strategy depends on making more profits than losses, while minimising risk-taking and equity drawdown.
With the advent of fast trading terminals, traders often use software to initiate, backtest, filter and program pairs trading.
- Want to trade pairs with increased leverage? Compare professional trading accounts
Executing a pairs trade
Some brokers like Interactive Brokers have pairs trading software (ScaleTrader) that allows customers to execute both legs quickly. Or you can trade the individual pairs separately through most CFD trading platforms and spread betting brokers like IG, CMC Markets and Saxo Markets.
The best time frame for pairs trading
A pairs trading strategy that holds instruments intraday will rely more on statistical analysis than fundamentals. A long-term (weeks to months) pairs trading strategy is inherently different to that of a short-term one in terms of signal generation, research and positional sizing.
One reason is that over the short-term market prices are fairly random and noisy. There is nothing to prevent a stock from gyrating aimlessly within a price range. This makes short-term pairs trading challenging because prices can quickly move against your model and hit the stop loss.
Added factors like news releases or economic data can also create short-term havoc against pairs trade. For example, better-than-expected unemployment data causes the weakest stock (that you are short) to soar while the lower beta one (that you are long) to lag.
Each time frame entails a different risk proposition. Traders must take this into account when designing the pairs trade strategy.
Choosing markets for pairs trading
There are many ways to capitalise on the pairs trading strategy. Markets to consider include:
- Large-cap stocks
- Mid-cap stocks
- Equity index futures (or ETFs)
- Commodities
- Sectors
A novice trader may focus on similar stocks within a popular sector (say, mining, banking or house builders in the UK) or between large indices. Note that larger stocks, such as FTSE 100 members, have better liquidity. Shorting a £20 billion stock is always easier than a £100 million one as slippage and spreads will be larger on smaller stocks, they should also be less volatile.
Examples of potential pair trades:
- FTSE 100 vs FTSE 250 index
- Barclays vs Lloyds
- Rio Tinto vs BHP
- Gold vs silver
- AstraZeneca vs Glaxo
Five Tips for Formulating Pairs Trade
Here are our five tips to help you improve your pairs strategy:
Tip 1: Filtering pairs trading candidates
Formulate pre-determined filters to extract viable candidates from noisy datasets. However, this is dependent on the skills of the traders. Is the trader much more comfortable with statistics, fundamentals or technical analysis? What is the trader’s edge? The strategy’s time frame is critical. Also, will the filter be done solely with computers? Once a pool of trade candidates is determined, the next step is to narrow down the specific trades to buy and sell.
Tip 2: Weighted volume when trading pairs
How much to trade on each leg, ie the amount to buy and sell? This is dependent on the trader’s goal. He may choose share-equal (100 shares to buy and short), dollar-equal ($1000 on buy and short), beta-neutral (long beta must match short beta), etc etc. A very volatile stock may inject more volatility into a relative trade if both legs are dollar-equal.
Tip 3: Pairs trading risks and costs
For each leg of the pairs trade, a stop loss level may be required. This means finding out where a strategy would close the trade if it goes sour. A trader would also need to find out the costs of shorting an instrument due to dividends and whether the stock is hard to short due to a limited freefloat, corporate action, or regulatory embargo. All this information must be known to the trader before hand.
Tip 4: Managing pairs trade risk
Sometimes, the easy part is to initiate a trade. The harder part is knowing what to do afterwards. To manage a trade, a trader will need answers to these scenarios, ie, when:
- Both legs (long and short) are instantly profitable – take profit, stay, or double up?
- One leg is profitable and the other in losses
- Both legs in losses suddenly
- A ‘short squeeze’ happens
Once a trade is entered, there must be a plan to get out. Sometimes, the stop loss will do that for the trader. If not, a trade will need to monitor the trade continuously to see if the trade’s potential is still there. Sometimes, after some time, the trade may be abandoned because it is not working out.
Tip 5: Pairs trading paper trading
Before committing real capital into a trade, it is better to take some time to backtest the strategy on paper. This is to iron all programming mistakes, bad data, to determine ideal parameters, or just to ‘get a feel’ for the strategy. Can you live with the drawdown? What is the appropriate capital to execute the trade? etc.
Pairs Trade Example: Buying and selling IG/CMC using Relative Ratio
In this section, I highlight a pairs trade example using IG Group (IGG) and CMC Markets (CMCX).
- Want to know more about these brokers? Read our expert reviews of IG & CMC Markets.
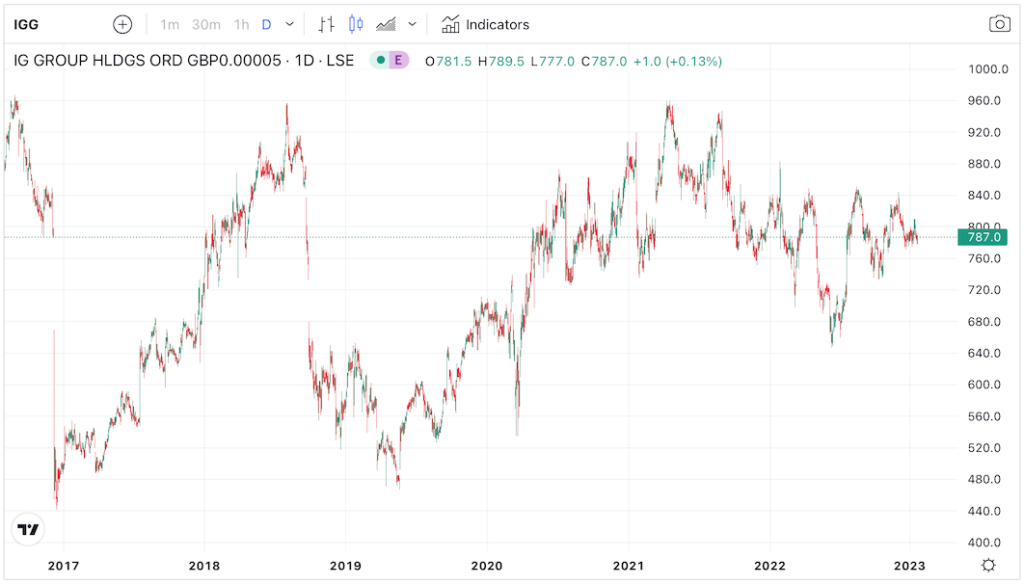
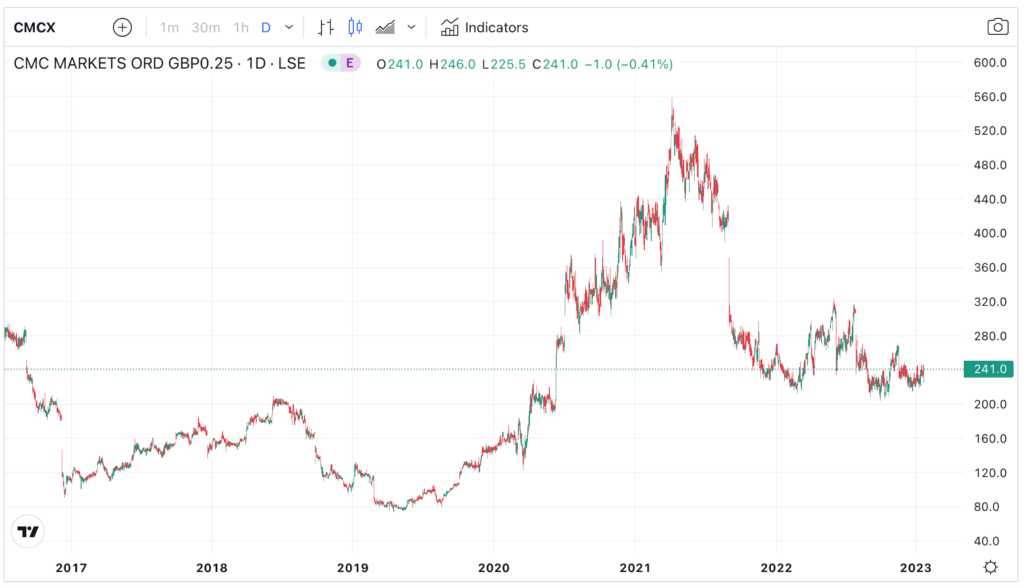
The stocks are selected from the same sector, that is, spread-betting brokers in the UK. Although IG Group is larger than CMC by a factor of 5 (IG’s market cap: £3.2 billion vs CMC’s £0.6 billion), both stocks are liquid enough to conduct a pairs trade.
A quick look at their share prices confirmed that both stocks trend up and down broadly. In other words, both stocks suffered from a bear market at the same time during 2018-2019; both boomed in the aftermath of the pandemic as trading activities soared.
The only question is how does each security move against one another during the bull and bear phase. If we can find out more about their characteristics, then we can design an appropriate pairs trade strategy.
Judging from their share prices, it seems that CMCX is the more volatile one. How do we know?
CMCX seems to exhibit a higher beta during ‘risk on’ and ‘risk off’ – because it outperformed IGG when the market is speculative. As an aside, perhaps this is due to CMCX’s smaller capitalisation too. A small-cap stock tends to rally the hardest when the market is overflowed with liquidity.


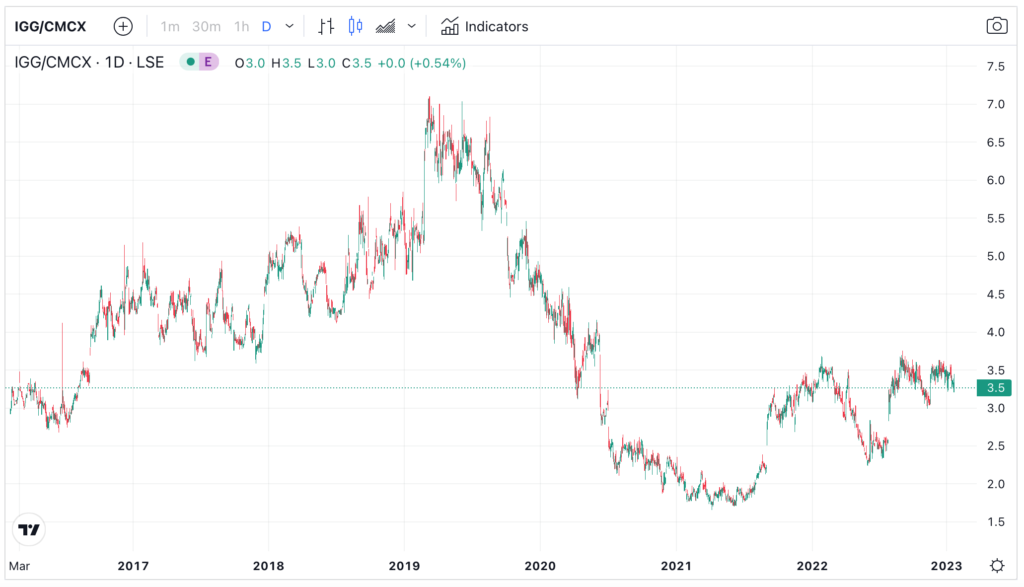
To see if CMCX really does have a higher beta, we plot a relative ratio between the two securities.
Relative ratios are computed using two prices, one over another, say A over B. The relative ratio is plotted below using the historical relative ratios between IGG and CMCX (prices of IGG divided by CMCX).
The higher the ratio, the better the performance of IGG over that of CMCX. Equally, the lower the ratio, the better the performance of CMCX against IGG.
From 2019 to mid-2021, IG underperformed CMC Markets significantly – the relative ratio slumped from 7.0 to less than 2.0 over the period. This confirms the observation that CMCX benefits more from ‘risk on’.

How should the relative ratio be used to initiate a pairs trade?
If I take the view that IG will continue to outperform CMC, then I will buy IG and sell CMC. This bets on the relative ratio rising above a certain threshold (say 3.5). Using equal dollar volume, I would:
- Buy £1,000 of IG shares (@780p per share)
- Sell £1,000 of CMC shares (@240p per share)
If IG’s share price rises 10% and CMC only by 8%, the profit is 10-8=2% (assuming zero cost). If on the other hand, IG share price rises only 15 and CMC by 30%, I will incur a loss of -15% (30-15=15%).
Of course, this is a simplistic example that takes no account of the volatility of both shares or trading commissions and overnight financing rates.
In real life, traders may tweak the above example into (as CMC is more volatile) to make sure the trade is more volatility neutral:
- Buy £2,150 of IG shares
- Sell £1,850 of CMC shares
Then, traders may even leverage the trade by borrowing shares on both buys and sells (or spreadbet via CFDs). This ‘juice up’ the returns if the trade works.
And instead of using relative ratio traders may choose the more sophisticated cointegration model to model the spreads between two securities.
Final Words
Overall, pairs trading is a popular strategy for traders seeking to speculate on the movements of multiple securities. Unlike long-only trading, a pairs strategy is more involved and complicated. Not only does it entails the modelling of two securities, it also requires a more detailed operational follow-up. Thus this strategy may not be suited for every investor. But, it is a good way to remain market neutral whilst speculating on individual instruments.
Pairs Trading Video Example:
In this video, we do a live pairs trade and go long and short IG & CMC Markets, two CFD and spread betting brokers listed on the London Stock Exchange.

Jackson is a core part of the editorial team at GoodMoneyGuide.com.
With over 15 years industry experience as a financial analyst, he brings a wealth of knowledge and expertise to our content and readers.
Previously Jackson was the director of Stockcube Research as Head of Investors Intelligence. This pivotal role involved providing market timing advice and research to some of the world’s largest institutions and hedge funds.
Jackson brings a huge amount of expertise in areas as diverse as global macroeconomic investment strategy, statistical backtesting, asset allocation, and cross-asset research.
Jackson has a PhD in Finance from Durham University and has authored nearly 200 articles for GoodMoneyGuide.com.


