Trend trading is one of the simplest investing and trading strategies. In a nutshell, trend trading is about buying and selling securities in the direction of the trend. First, a trend is identified. Then, you ride the trend to profit from price changes. Trend trading can be applied to different time frames (daily/weekly or intraday).
But how easy is it to make money from trend trading? This guide will explain what trend trading is, the different types, the risks and gives some practical examples of how you can profit from trends in the financial markets.
There Are Three Types Of Price Trend
Trend trading, first of all, requires you to identify trends. But you may wonder what type of trends are there in markets.
In simple terms, financial price trends move in three ways:
- Uptrend
- Downtrend
- Sideways (or Flat-trend)
Uptrends
Uptrends are easy to spot if they are persistent. Take a look at Meta Inc’s (META, formerly known Facebook) chart below.
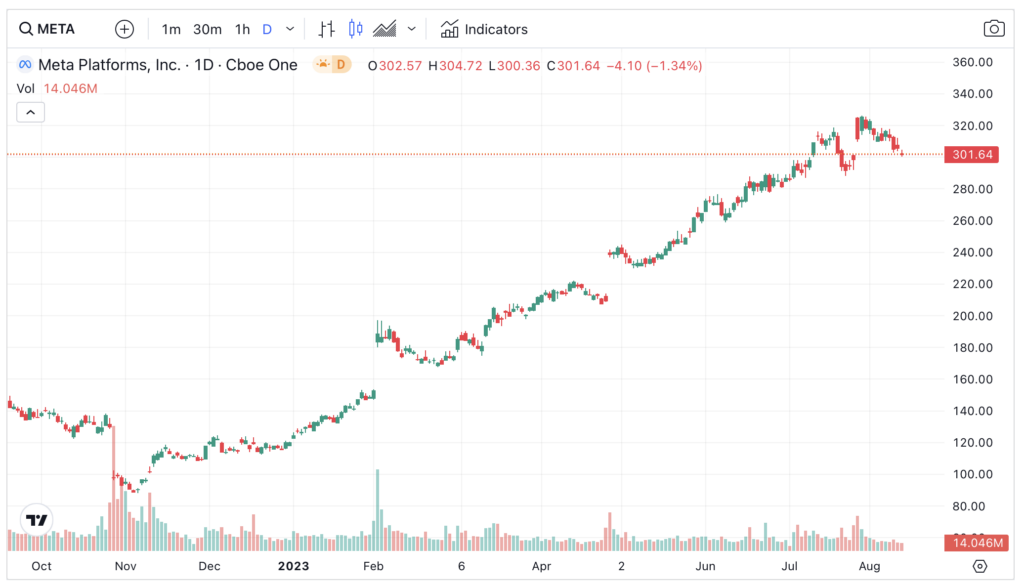
What sort of trend do you think this is? A casual glance will tell you that this is an uptrend – and a very smooth one too. Prices started to rise from $100 back in November 2022 and then climbed non-stop for the next 9 months, in a near-perfect straight line.
When many stocks are in an uptrend, it is known as a ‘bull market’.
An uptrend is characteristically defined by a few visual patterns:
- Higher highs, followed by higher lows
- Unexpected positive price moves, often accentuated by overnight price gaps backed by high volume.
- Prices surge to new long-term price highs, and overcome prior resistance points with ease
Downtrend
In complete opposite to an uptrend is a ‘downtrend’.
The main visual characteristic of this trend is that prices keep moving south. Below is a clear example of a downtrend, the price of Treasury bonds over 2021-2022.
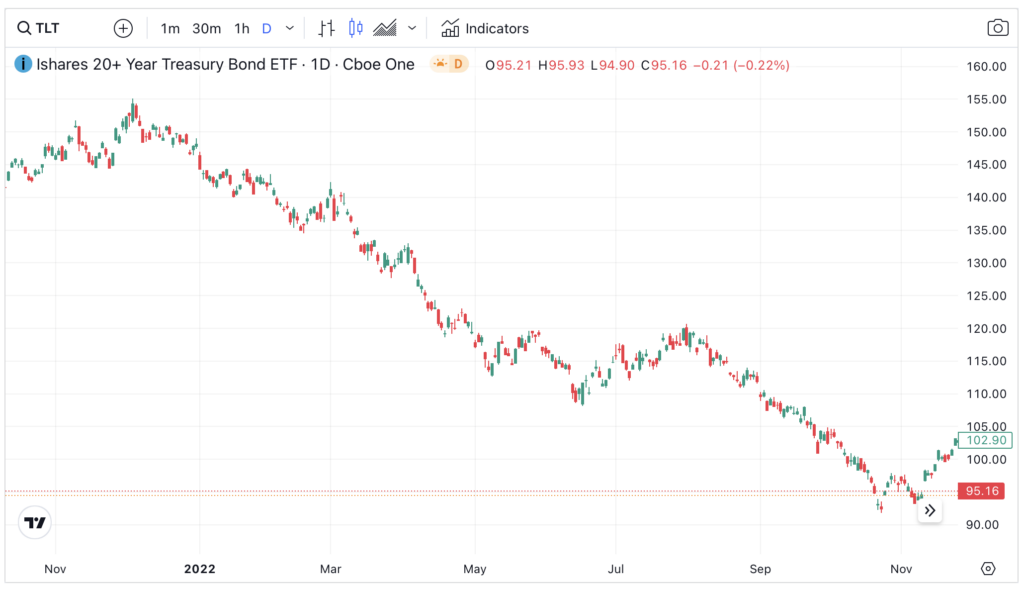
As interest rates kept rising since 2021, bond prices slumped. Ergo, the iShares Treasury Bond ETF (TLT) depreciated for nearly a year from 150 to 100. There was a bear market rally but it was a weak one.
Broadly speaking, when many stocks are in a downtrend, we call it a ‘bear market’.
Related Guide: How to invest in a bear market
A downtrend is characteristically defined by a few chart developments:
- Lower lows, followed by lower highs
- Unexpected negative price moves, often accentuated by overnight price gaps backed by high volume
- Drops to new long-term price lows, beneath prior support levels
Sideways trend
The last trend is a horizontal one, whereby prices move up and down within a defined range. A stock may exhibit this sort of behaviour when the supply and demand of the security is evenly matched.
A good example is Barclays (BARC) over the past few quarters. Prices first established the range at 140-170p; then attempts to push out of this range failed. The upside breakout failed at 180p; the downward attempt lost momentum at 130p.
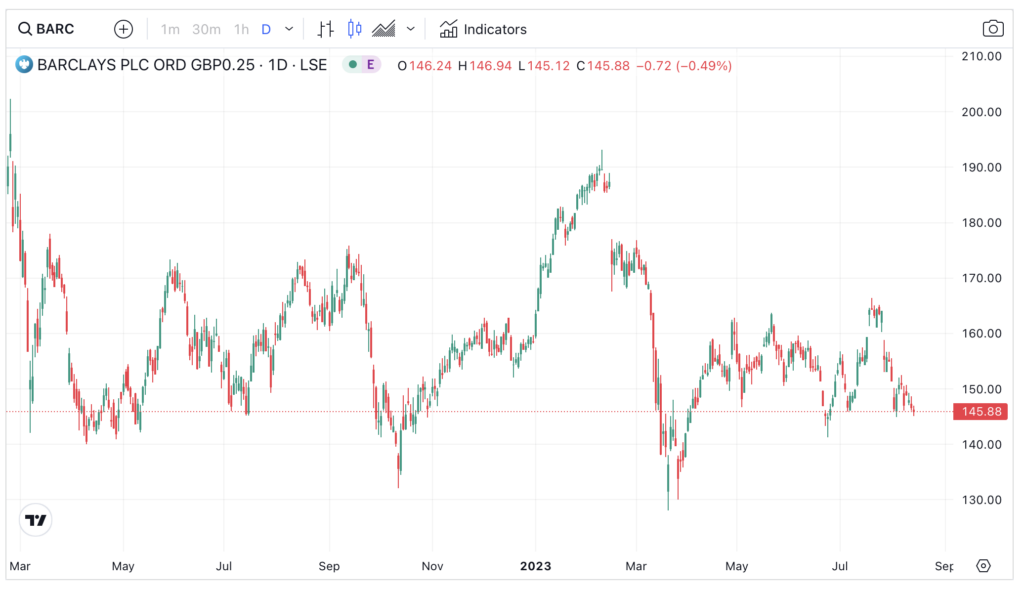
In the case of a flat trend, it is difficult to make money consistently as prices are not moving too far away from the floor or ceiling. You may buy near the floor or sell at the ceiling to bet on ‘reversionary’ moves, that is, prices moving back into the range.
How to Detect and Spot Trend Changes?
Avid readers of financial history will tell you that a price trend does not last forever. Trees don’t grow to the sky, as they all say. That’s a cardinal rule to remember.
Based on this observation, it is safe to say that at some point, a trend will change. This change is driven by a few possibilities including:
- new investor sentiment,
- changes in the valuation of a security,
- new economic or macro conditions, or
- unexpected fundamentals of the stocks.
Conditions always evolve. The only constant in markets, as many experience investors would attest, is change.
The key is how to spot when a price trend is about to change direction.
Ideally, traders need to spot a starting trend as early as possible in order to maximise the reward. Then, traders must also ‘ride’ the trend as long as possible to gain from the bull trend.
How to detect a potential uptrend
An uptrend is characteristically defined by higher lows. But before these patterns have developed, a chartists should look for uninteresting stocks making a base or bearish stocks near the end of a downtrend.
Search for potential uptrends among these securities:
- Basing stocks – stocks that have been trading quietly in a tight price zone for some time (we are talking about months or years)
- Extremely bearish stocks – that are reaching the end of their downtrends
Let us walk through an example to show what the above means. Here I use Alibaba (BABA) as an example. The company is the largest e-commerce stock in China and worth more than $200 billion. In 2015, the company IPO’ed in US. As the initial IPO euphoria subsided, prices dropped and then collapsed. BABA lost more than 50% of its value its post-IPO peak in a matter of months. Prices broke to new all-time lows almost every other week.
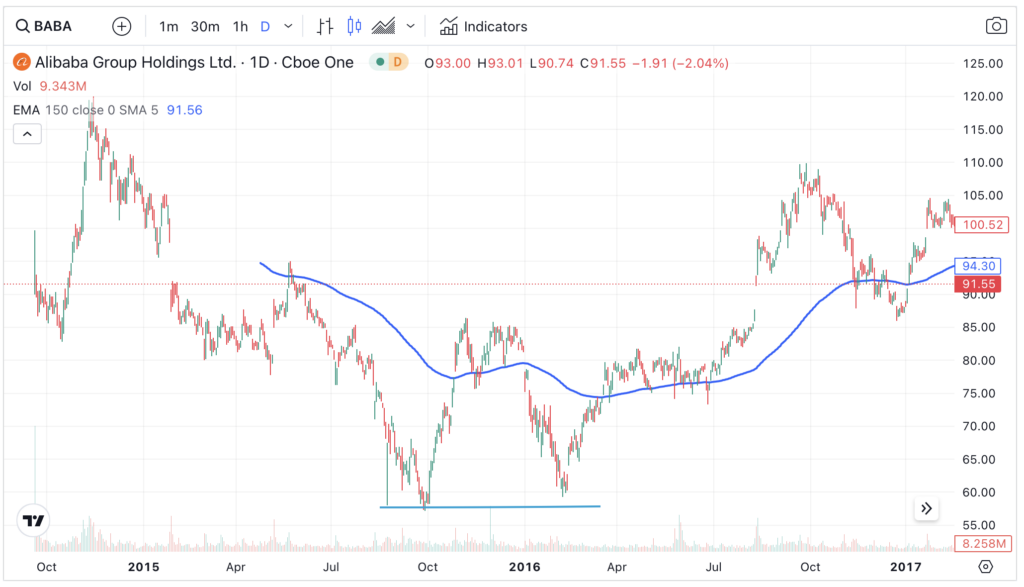
As you can imagine, sentiment was awful. However with the benefit of hindsight, that post-IPO decline was the start of a multi-year rally.
Here is the checklist to recognise a potential positive trend change:
- A steep downtrend that lost momentum (potentially at key round number)
- A sharp rebound, followed by a re-test of the lows
- Failure to reassert the downtrend at prior support level, leading to another firm rebound
- Breakout at key base resistance
- Prices cross above long-term trend indicator (150-day or 200-day moving average)
Did you recognise all these traits here in BABA’s chart? By the time prices broke above $80 in early July, that would have been a very clear buy signal.
How to discover downtrends
The chart pattern for a downtrend is slightly different to that of the uptrend.
Generally, we don’t really search for downtrends that have yet to begin. This is because of this fact: A wonderful uptrend always overshoot to the upside. Why? This is because investors tend to become over-excited about a sector. In the mad rush to own the stock, investors push prices far beyond what it is actually worth.
I tend to look for potential downtrends from stocks that are:
- Accelerating to the upside, thus fulfilling its long-term potential
- Breaking down from its toppy formation, thus creating fear and panic
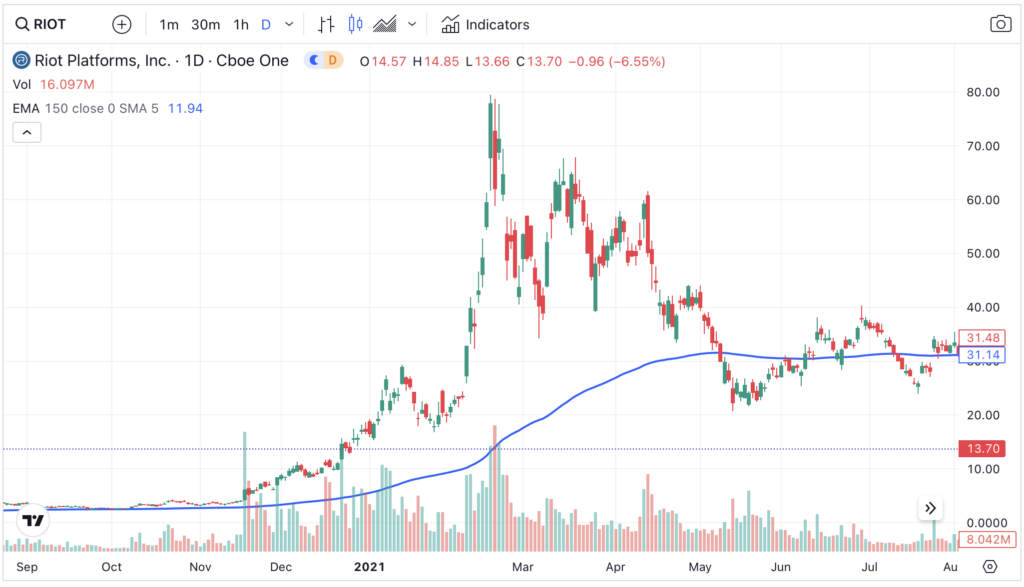
What do I mean when I say ‘accelerating uptrends’? Perhaps a chart from Riot Platform (RIOT) would be more illustrative.
The Bitcoin miner was trading at just $3 during the summer of 2020. By February 2021, as the Bitcoin mania went full swing, it soared to $80. Its uptrend was extremely vertiginous. Alas, wonderful rallies like this can’t last. And it did not. Prices traded above $80 for only three days. From $80 prices then retraced all the way back to $20 a few months later.
The next time you see such an extreme rally, sell out and wait. For more adventurous traders, you can watch to short-sell into established downtrends.
GMG Trading Guide: How to short sell securities
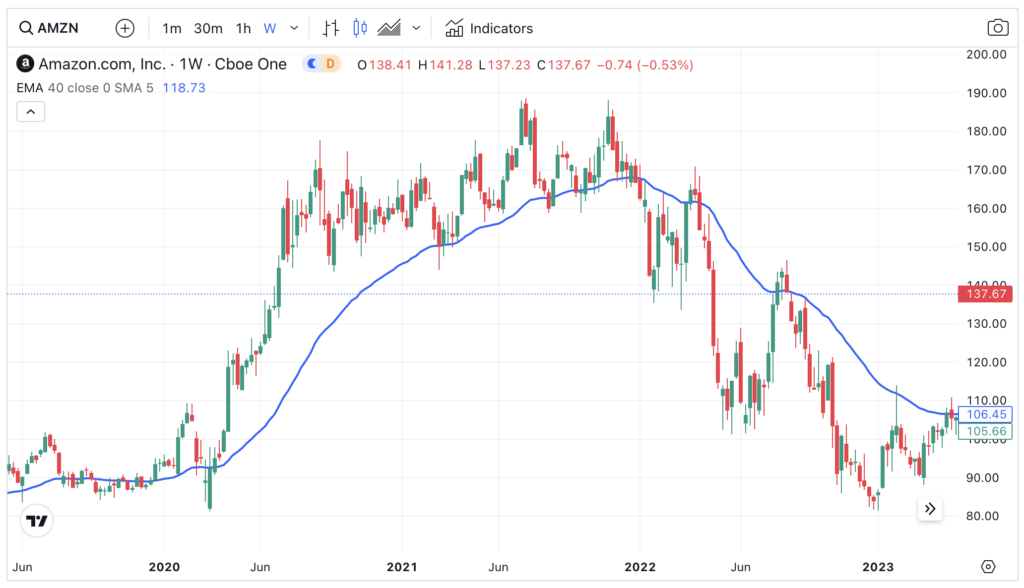
Another downtrend is a toppy formation and breakdown – Amazon (AMZN) is a good example. The stock was trading in a tight range for months in 2021 despite the bullish wider market. The tech behemoth tried to climb above $190 twice and failed. The signal that really bode ill was the sharp break down below the $160 support in early January 2022. Prices swiftly slumped to $140 soon after. Moreover, a retest of that level failed in April 2022, leading to another leg down to $100.
Here is a checklist to recognise a potential negative trend change:
- Accelerating price rallies – massive gains over a short period leads to instability
- Breakdown from toppy formations, beneath major support levels
- Weak relative strength – that is, it lags both the bullish market and sector trends
- Prices sink below long-term trend indicators, such as the 200-day moving average
When you overweight a stock and it starts to break down (like Amazon above), selling some shares is a prudent strategy since you will not know how low the downtrend will go.
Guess what price did Riot (in the previous example) bottom out? It touched $3 in December 2022. Buyers who were sucked in at $50 during the mania would have suffered a 94% decline. Ouch!
Effective Trend Trading Tactics
What to do when you discover a potential new uptrend?
- First, you have to accept that very few traders are able to capture the entire trend. To do this accurately means you have to sell at the perfect top and buy at the absolute bottom. This is impossible. Not even legendary traders can not manage that year in, year out.
- Second, emerging price trends often “fool” the market. In other words, these trends may or may not prolong into substantial price moves. A trend failed at any time. It can break, retrace or move sideways.
- Third, sticking with a good trend is essential, since it helps to make up for most other ‘bad trends’ that result in losses. In other words, winnings from a strong trend must be more that the aggregate losses from failed trends. As long as the uptrend is intact, you stick with it.
- Fourth, not all trends are equal. Some trends are smooth; some are far more volatile. Each stock is a different animal. You have to be prepared against ‘whipsaws’ – violent counter-trend moves that push you out of the position temporarily before the stock resumes the trend.
Based on these observations, to trade trends over time you should aim to:
- Start with appropriate position sizes – positions that you can handle
- Gradually add if the direction is right (leverage)
- Use trend indicators to help you stay in profitable trends for as long as possible
- Have stop losses to exit unprofitable trends
Moving Average as Trend Indicators
Bear in mind that financial prices are ‘noisy’. Seldom are they smooth and move in one firm direction. More often than not, a stock will zig-zag. Prices go up $10, drop $5, rise another $3 etc. This makes them difficult to read and trends harder to trade.
Therefore, a trend indicator is needed to discern a price trend. One such immensely popular tool is the moving average.
In its simplest form, a moving average is just a running sum of past prices divided by a number (the ‘parameter’ M). The most popular parameters are 20, 50, 150 or 200 days. Simply, a moving average smooths past prices and creates reference points for visual analysis.
How to use a moving average in trend trading:
- To determine a trend. If prices are higher than a long-term moving average, the stock is said to be in an uptrend. If prices are below the MA, the stock is in a downtrend. We can use this to separate stocks within a universe into bullish and bearish trends.
- Uptrend = Prices above MA
- Downtrend = Prices below MA
- Using MA as trading signals. If a stock is in an uptrend, buy. If a stock is in a downtrend, sell.
- Contrarian reference using MAs. If a stock is significantly above its long-term MA – say 20% – label it ‘risky’. Stop buying the instrument as it is vulnerable to a sharp correction back to its long-term MA.
- MA as support and resistance. A long-term MA often acts as support or resistance during a trending phase. (see last week’s piece on S/R)
- Stick to parameters consistently – and not to vary MA parameters too often. Many use three MA trend indicators:
- Long-term trend– 150 or 200-day MA
- Medium-term trend – 100-day
- Short-term trend – 50-day
Are moving averages useful? Absolutely. For one, many traders use them to trade markets. This leads to self-fulfilling feedback in markets. Second, these smoothing devices are flexible enough to apply to most financial time series, from stocks to exchange rates to commodities.
But remember that a moving average is a lagging indicator. It will not forecast trend changes; neither will they anticipate the size of the trend. It just follows what prices were in the past.
Below I show an example of how a moving average can be used to capture a trend for investing.
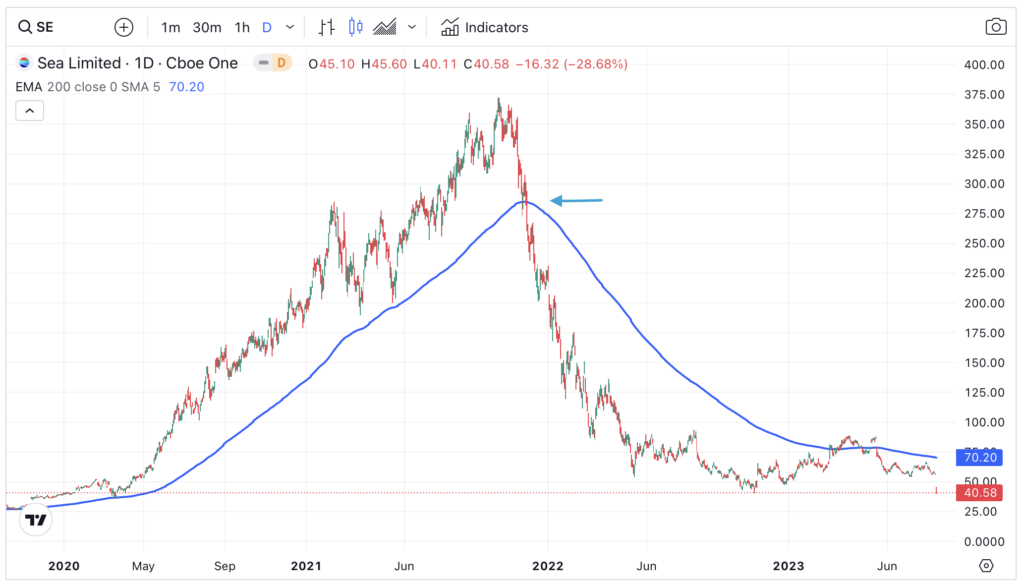
Let’s say you were looking at low-risk idea and found Sea Limited (SE), a high-growth Asian company with gaming and tech businesses. Prices were trading in the low $20 and then flipped north of the 200-day MA. You buy. Position in profit immediately. When do you sell?
According to the trend tactics, you will try to stick with the position for as long as possible. Using the 200-day MA this meant you hold from $40 all the way to $280 (holding for 18 months), only exiting when prices sank below the 200-day MA. You are lucky because prices quickly plunge to $50.
In Summary
Trend trading is trading activities based on riding trends in financial instruments. This is an effective way to make money in the market.
Of course, trend trading is not for everyone since many investors prefer fundamental-based investing or trading.
To profit consistently, you will need a full system to detect trends, hold onto winning positions, and signals to exit. Following the preset plan is essential since you have to be strict in weeding out losses. A trend – even a consistent one – can emerge at any time.
Good trend traders will there utilise both stops and limits to protect their trades. Stops will ensure that small losses do not grow to account-killing losses. Remember, no system is going to be 100% accurate at catching every trend. Longevity is paramount.

Jackson is a core part of the editorial team at GoodMoneyGuide.com.
With over 15 years industry experience as a financial analyst, he brings a wealth of knowledge and expertise to our content and readers.
Previously Jackson was the director of Stockcube Research as Head of Investors Intelligence. This pivotal role involved providing market timing advice and research to some of the world’s largest institutions and hedge funds.
Jackson brings a huge amount of expertise in areas as diverse as global macroeconomic investment strategy, statistical backtesting, asset allocation, and cross-asset research.
Jackson has a PhD in Finance from Durham University and has authored nearly 200 articles for GoodMoneyGuide.com.


