Pepperstone and Aston Martin F1 Team strike top sponsorship deal
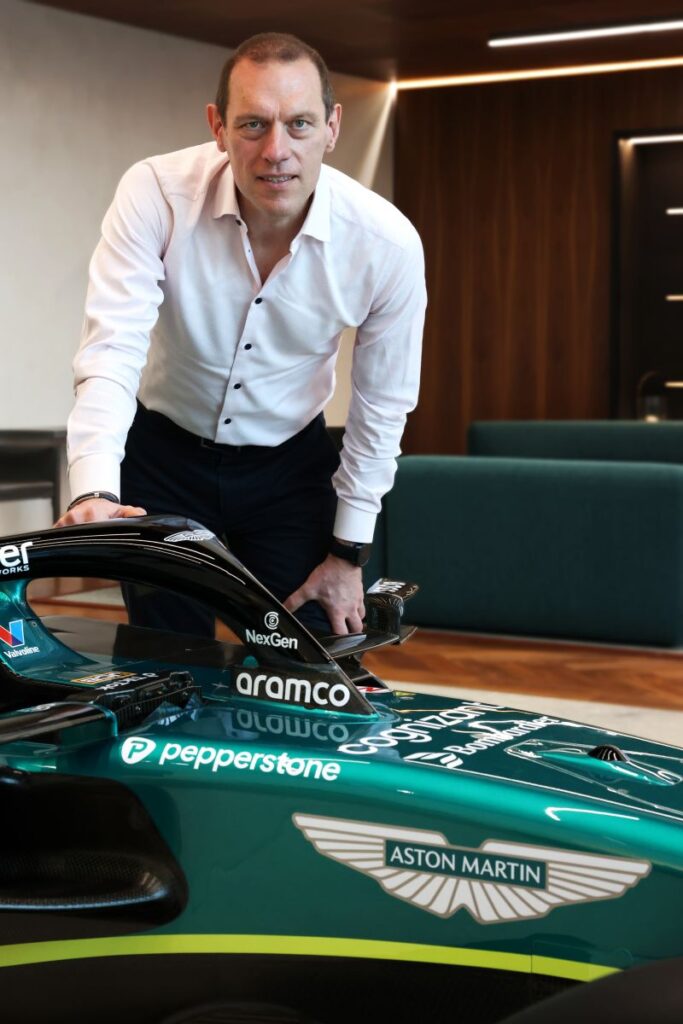
Trading platform Pepperstone has struck a deal with the Aston Martin F1 Team to become the latter’s official global forex and trading partner. Under the new partnership, Pepperstone branding will debut on the AMR25 Formula 1 racing car when it is launched ahead of the 2025 F1 season. Pepperstone CEO Tamas Szabo said: “We are […]
Pepperstone and Aston Martin F1 Team strike top sponsorship deal Read More »