
If you want to own investments that outperform the market then you need to pay attention to relative strength index analysis.
Relative strength indexing is about finding financial instruments that are generally outperforming – or underperforming – specific benchmarks, or a group of similar instruments. What is interesting about relative strength is that it persists.
How do you spot good relative strength?
Spotting Relative Strength in Prices
Relative strength can be identified in a few ways. One of them is to filter stocks that are at new all-time highs when the general market is generally subdued.
When a stock trades at new price highs, it tells you a few things.
- One, there is good demand for that stock, perhaps supported by favourable fundamentals.
- Two, all previous buyers are sitting at profits, which make them less inclined to sell (at least for a while).
- Three, stocks that are at new highs attract attention and more buying. All these factors combine to create a ‘buying squeeze’ which pushes the stock higher.
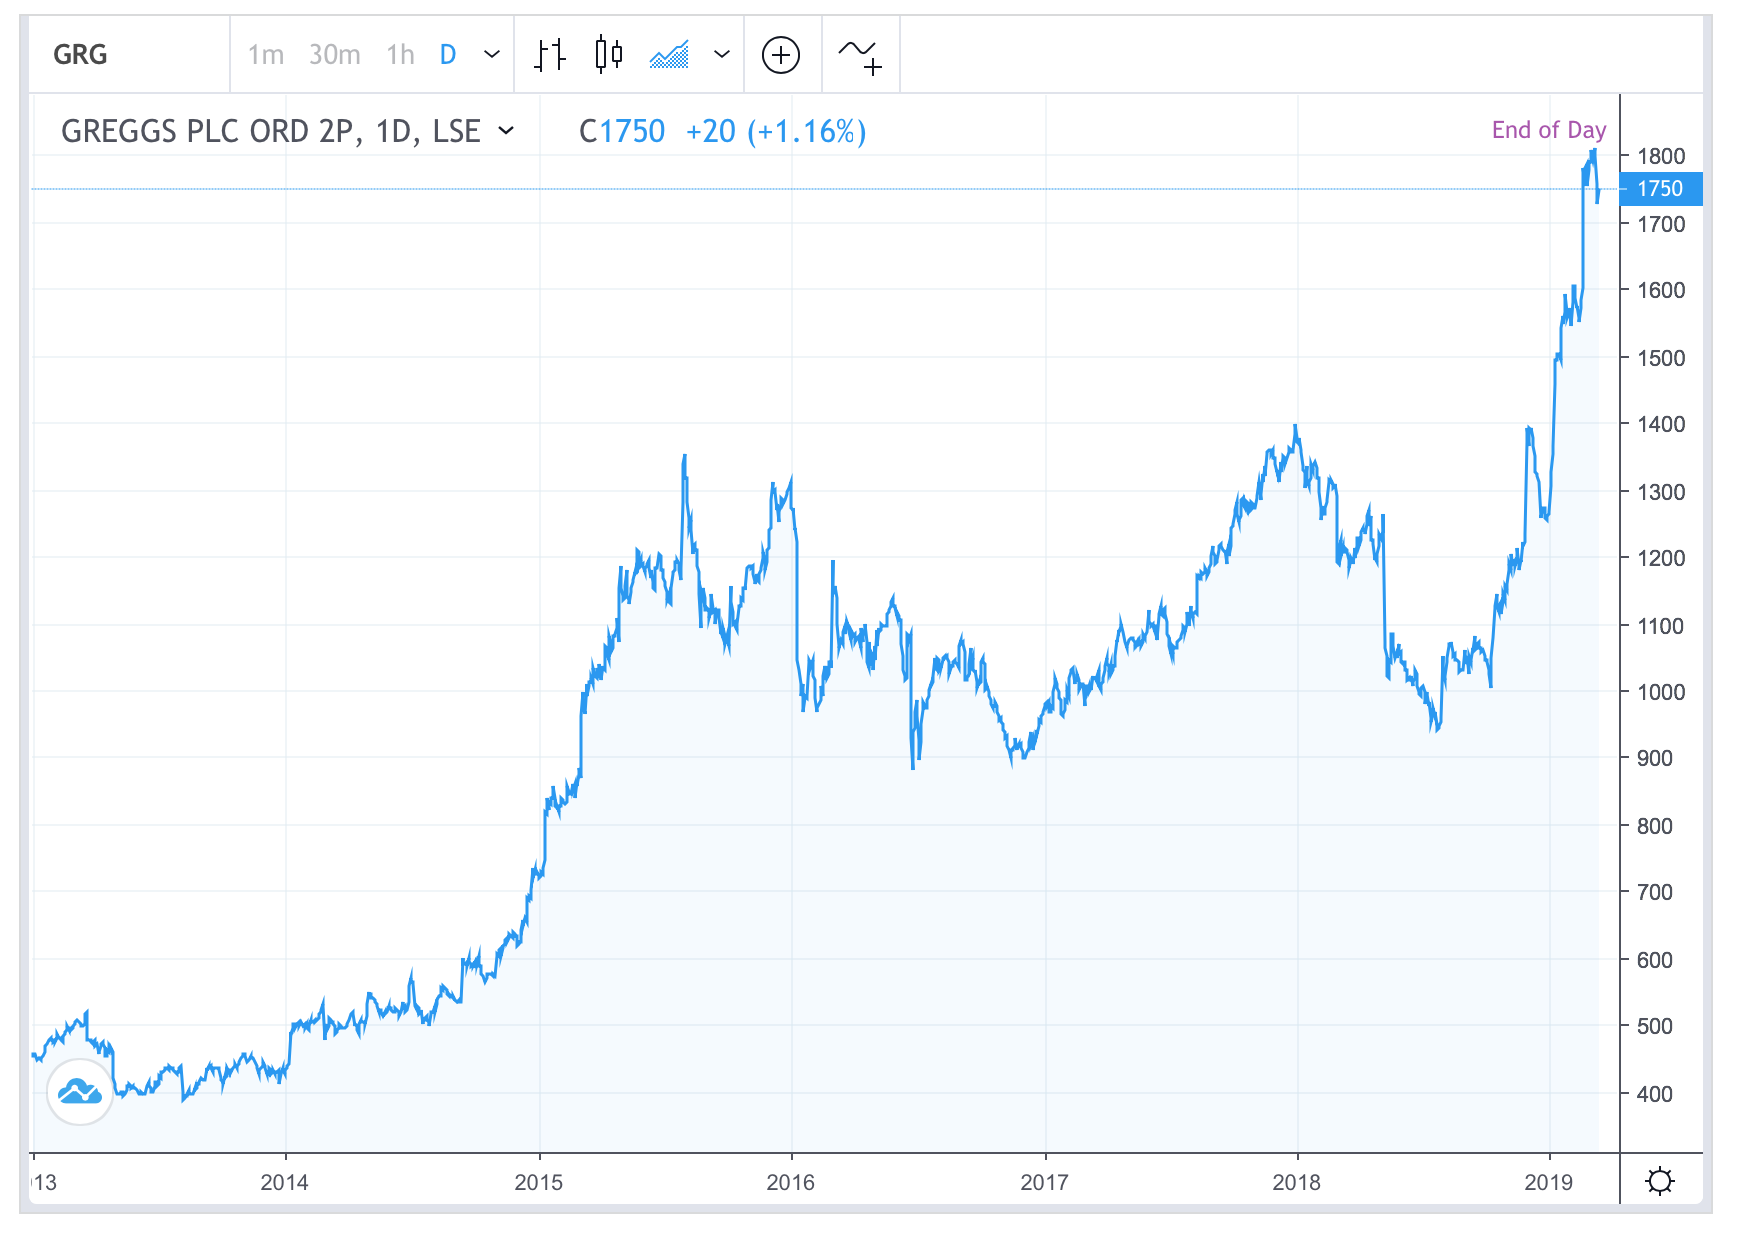
For example, look at the pasty maker Greggs Plc (GRG) from a few years ago below.
After a six-month consolidation in 1H2018, Gregg’s relative strength turned around decisively in the second half. Even better, prices soared to record highs in January whilst the market was struggling. Investors were clearly accumulating Greggs’ shares. Unsurprisingly, the stock smashed the 1,400p resistance soon after. Multiple new highs followed. If you bought at the breakout point at 1,400p you would have earned 28% in two months!
One tip: Watch to buy stocks that are the first new upside breakouts after a general market consolidation/correction. These stocks have the best momentum and are likely to advance further into uncharted territories in the coming weeks and months.
Watch these UK stocks that are making new long-term highs: Marshalls (MSLH), Fisher & Sons (FSJ), Britvic (BVIC), Compass (CPG), Diageo (DGE), Halma (HLMA) etc etc. Capital is flowing into these stocks.
- Related Guide: Compare the best UK stockbrokers
Using Relative Strength To Choose the Best Instrument Within a Sector
Another way to spot good relative strength is top-down via sector indices.
Most stock markets have sector indices. In the UK, FTSE 350 Sector indices are widely used. These include industries such as Banks, Mining, Life Insurance, Beverages, etc. These sector indices give you ideas which sector is outperforming the benchmark index.
First determine the stronger sectors using a fixed time frame (say six-month performance). Then filter out the strongest stocks within these sectors. Use technicals to confirm candidates.
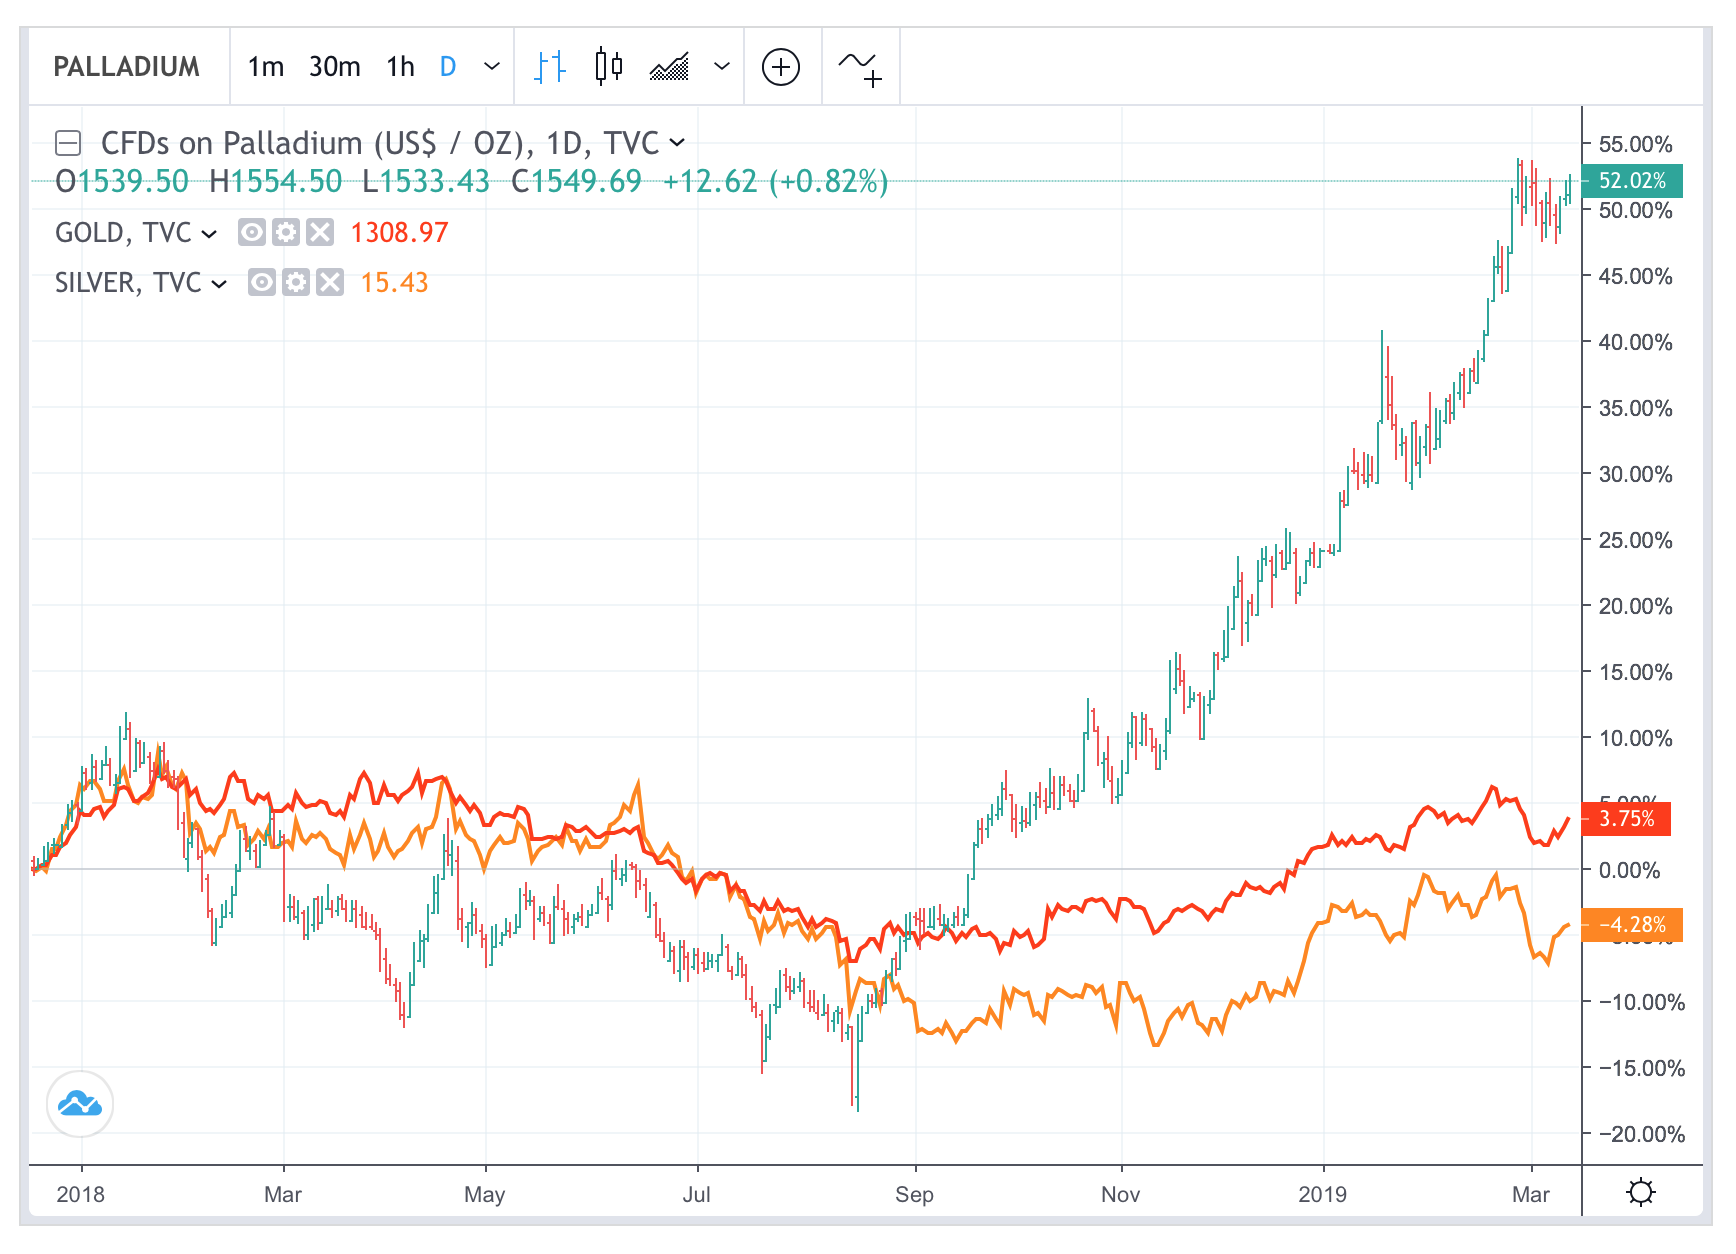
This relative strength concept is readily applicable currencies or commodities as well. Take the precious metal sector as an example. Throughout the first nine months of 2018, Gold, Silver, and Palladium were all trading leisurely at the same pace. That changed in October when Palladium suddenly came into life. This metal started to outperform others, first tentatively, then aggressively. Its relative strength lasted many months (see below).
When a sector/stock starts to outperform, pay attention.
What About Laggards?
For those stocks with very poor relative strength – avoid them. Stocks showing persistently poor relative strength is a sign of distribution.
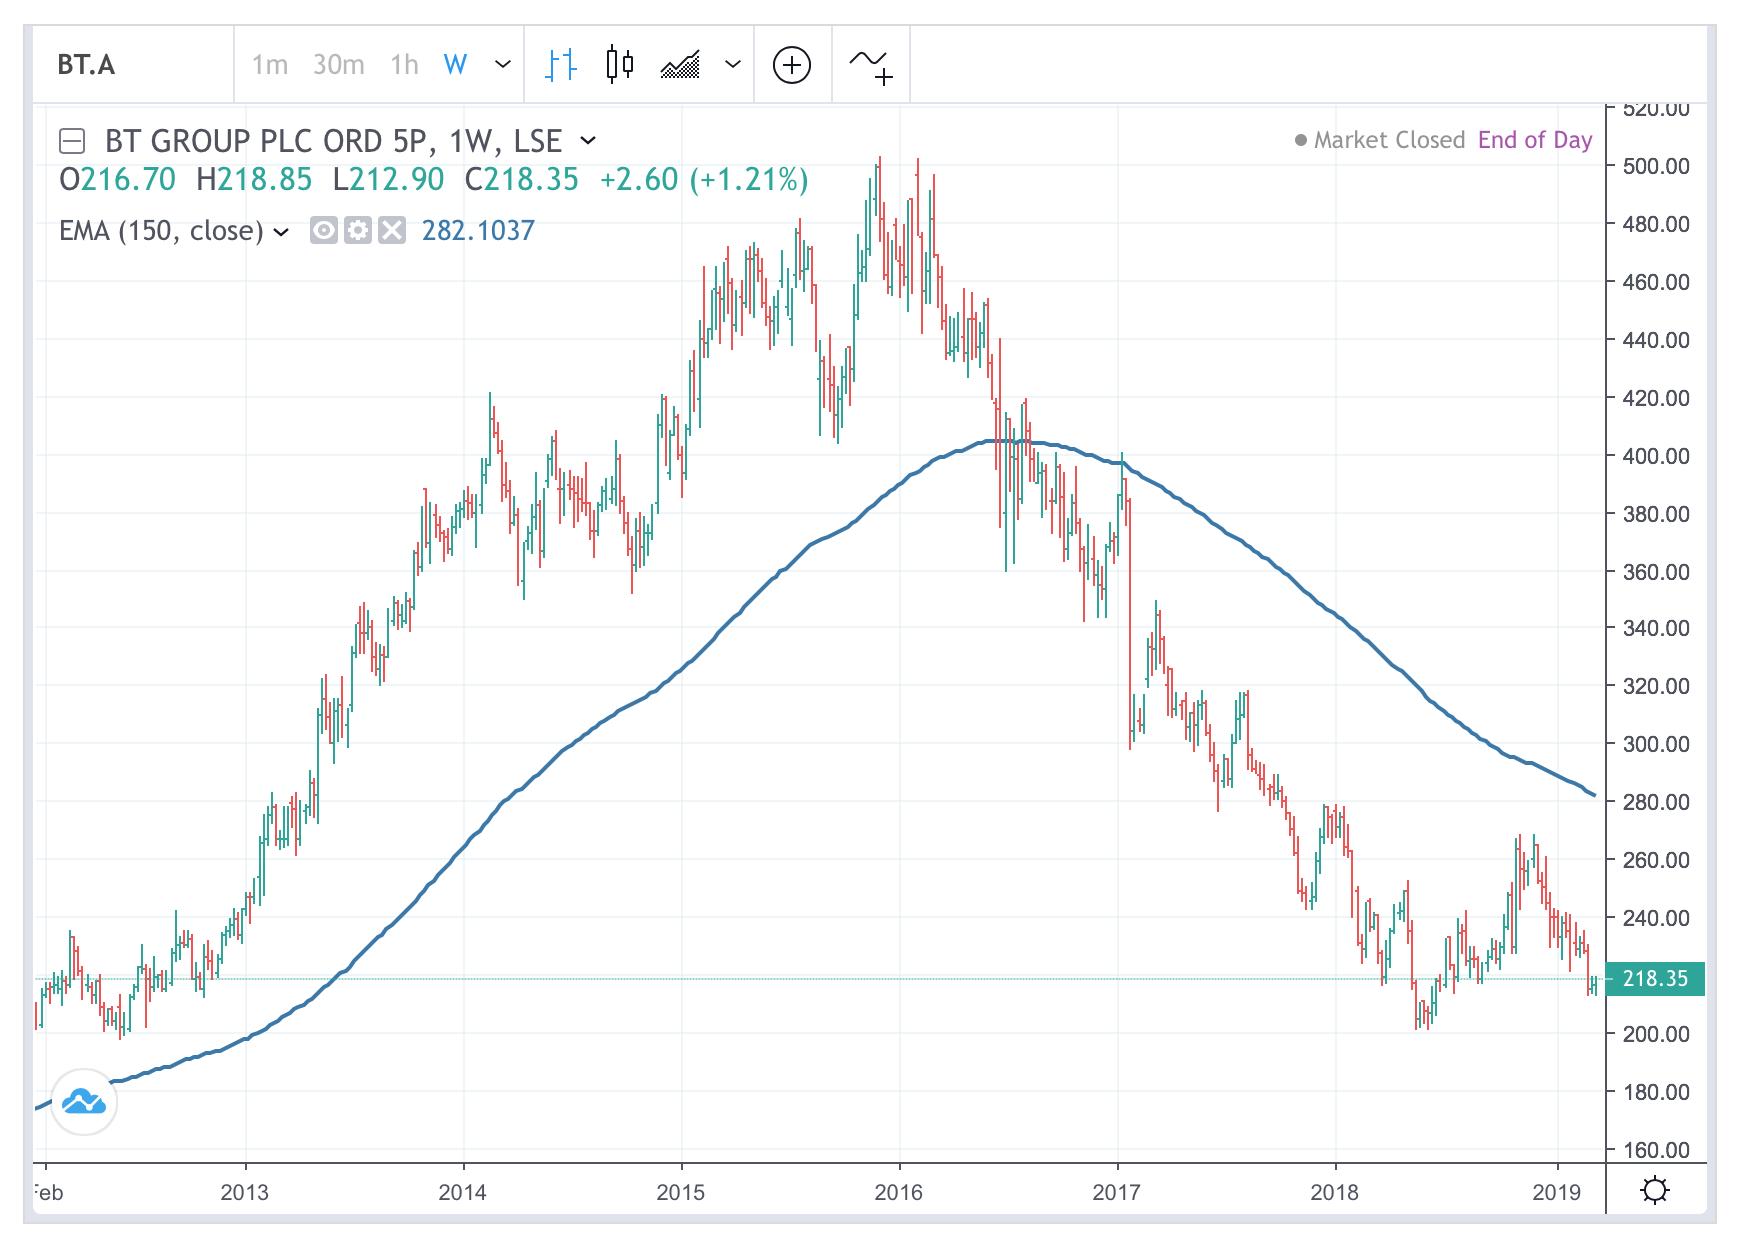
For example, after BT Group Plc crashed below 400p in 2016, all is not well. Its poor relative strength lasted another 3 years, resulting in another 50% drop in share prices.
Stocks that making new all-time/long-term prices lows are likely to continue in that southern direction. Momentum goes both ways. A trend, once established, is likely to continue.
In summary:
- Relative strength analysis is a useful concept in market analysis and trading. It helps you to buy outperforming instruments and avoid underperforming ones.
- Relative analysis is applicable to equities, sector analysis, currencies or commodities.
- An instrument’s relative strength, once established, usually persists for some time.
- But relative outperformance does not last forever. It will end at some time. When it does, trim/exit positions. Use trailing stops.

Jackson is a core part of the editorial team at GoodMoneyGuide.com.
With over 15 years of industry experience as a financial analyst, he brings a wealth of knowledge and expertise to our content and readers.
Previously, Jackson was the director of Stockcube Research as Head of Investors Intelligence. This pivotal role involved providing market timing advice and research to some of the world’s largest institutions and hedge funds.
Jackson brings a huge amount of expertise in areas as diverse as global macroeconomic investment strategy, statistical backtesting, asset allocation, and cross-asset research.
Jackson has a PhD in Finance from Durham University and has authored over 200 guides for GoodMoneyGuide.com.