This analysis and data looks at which US presidents have been best for the stock markets. We have compared the performance of the Dow Jones Industrial Average and the S&P 500 against presidential terms of office over the past 100 years.
Presidents come and go. But they all leave indelible marks on markets.
In just over a month, Donald Trump will return, after a four-year gap, to 1600 Pennsylvania Avenue, where he will serve as the 47th POTUS. Already, since his election triumph on November 4 the American financial market has been celebrating incessantly. Bitcoin, last I checked, trades north of the magical $100,000 mark. S&P, Nasdaq, and Dow are all flirting with new all-time highs (again).
Investors seem to have ‘disremember’ all the negative factors, such as the relatively high interest rates, military conflicts in Ukraine, weak Chinese growth, or stuttering wage growth. In market speak, the US market is furiously climbing a thin ‘wall of worry’.
While the spectacular Trump Trade is in full swing, it is worth reminding readers that the current bullish and frothy investor sentiment developed during the Biden administration. Yes, the 82-year old president couldn’t sustain his time in office by another term. Under his watch the market did not do too badly. In fact, by several return metrics they almost match Trump’s first term.
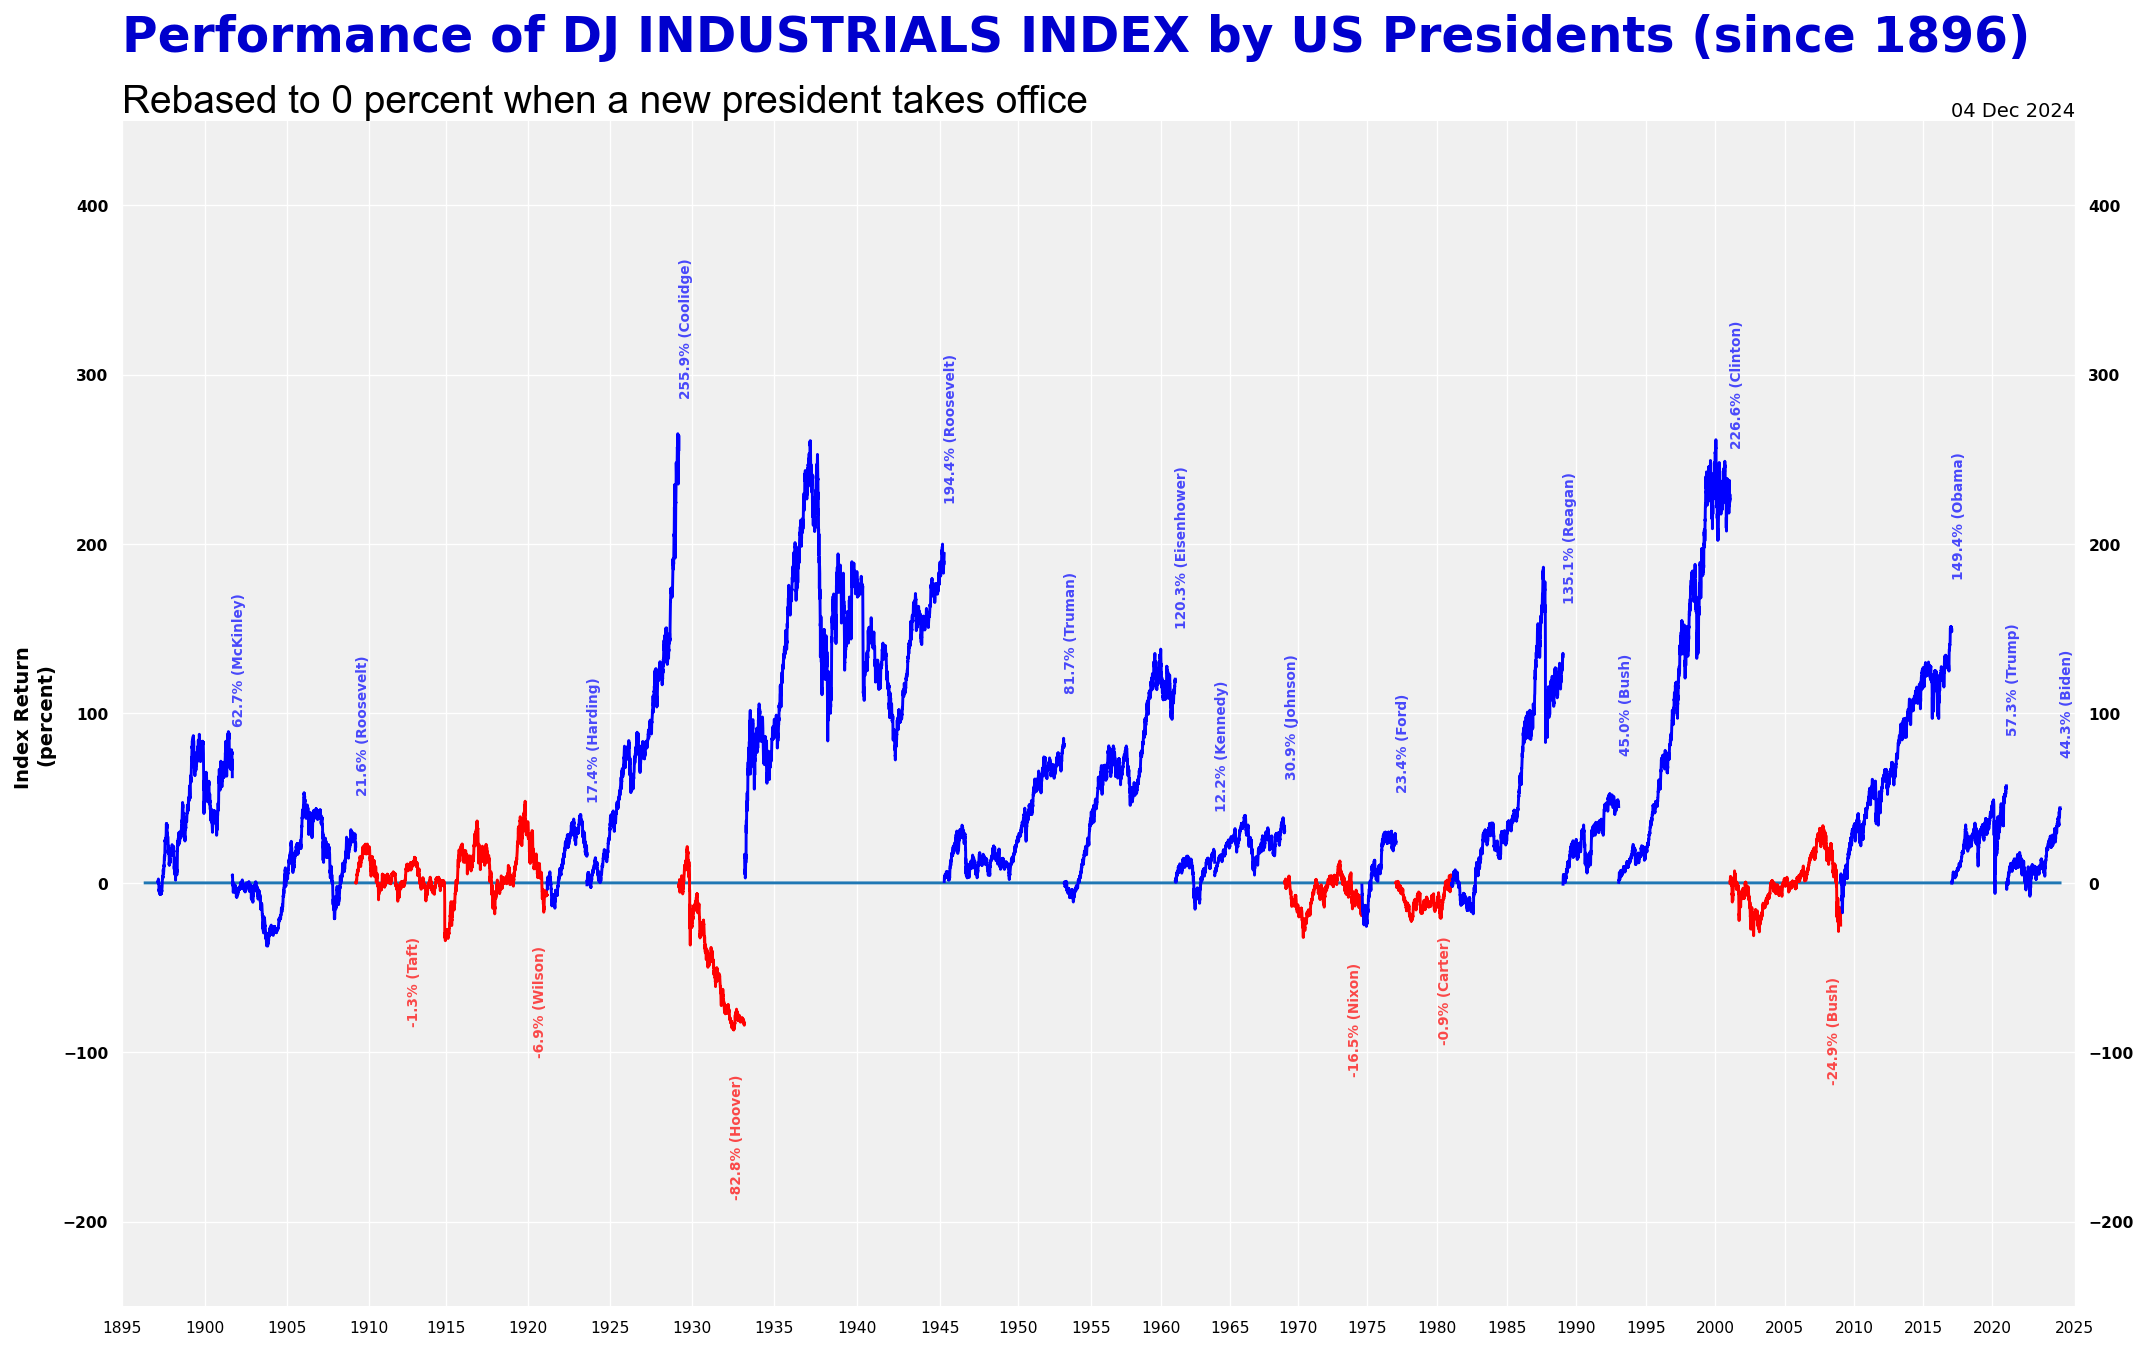
Below is the market performance of the Dow Jones Industrial (since 1896) overlaid with US presidential terms.
To create this chart, the equity index is rebased to zero whenever a new president takes office. For example, the last presidential swearing in occurred on the January 20, 2021. The Dow closed at 31,188.28 that day. Since that time, the index has rallied by a significant 44 percent (as of December 4, 2024, see below).
During Trump’s first term, Dow rose by more than half (57 percent). During Obama years, the Dow surged by almost 150 percent. Of course, this massive rally was caused by a sharp rebound following the steep decline in the latter months of the Bush II presidency.

| President | DJIA Returns |
| McKinley | 62.7% |
| Roosevelt | 21.6% |
| Taft | -1.3% |
| Wilson | -6.9% |
| Harding | 17.4% |
| Coolidge | 255.9% |
| Hoover | -82.8% |
| Roosevelt | 194.4% |
| Truman | 81.7% |
| Eisenhower | 120.3% |
| Kennedy | 12.2% |
| Johnson | 30.9% |
| Nixon | -16.5% |
| Ford | 23.4% |
| Carter | -0.9% |
| Reagan | 135.1% |
| Bush | 45.0% |
| Clinton | 226.6% |
| Bush | -24.9% |
| Obama | 149.4% |
| Trump | 57.3% |
| Biden | 44.3% |
| (as of December 4, 2024) | |
One may object to the usage of the Dow as a benchmark index, due to its somewhat restrictive members. If I switch to another macro equity instrument, will the result be any different?
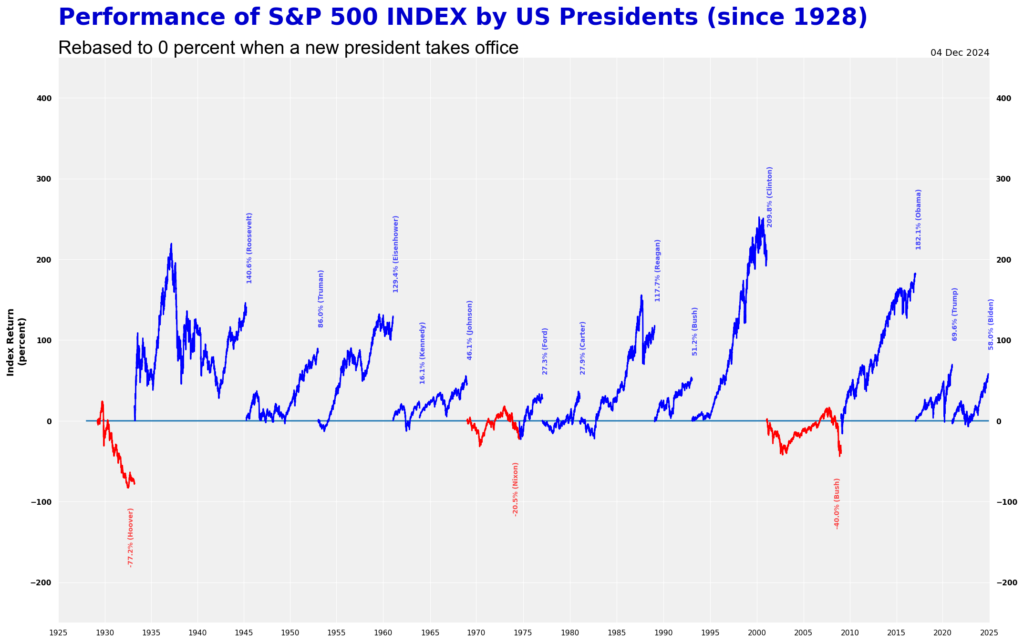
I applied above calculations in the same exact way to blue-chip S&P 500 index. This index, with 500 constituents, is a far better representative of the American stock market. The downside of this index is that has a shorter data (since 1928).
Still, the results are somewhat similar to that of the Dow. The Biden years aren’t bad. S&P rose by more than 50 percent. Equity prices have performed far better than anyone expected given the shaky macro factors, geopolitical tensions, and covid.

| President | S&P Returns |
| Hoover | -77.2% |
| Roosevelt | 140.6% |
| Truman | 86.0% |
| Eisenhower | 129.4% |
| Kennedy | 16.1% |
| Johnson | 46.1% |
| Nixon | -20.5% |
| Ford | 27.3% |
| Carter | 27.9% |
| Reagan | 117.7% |
| Bush | 51.2% |
| Clinton | 209.8% |
| Bush | -40.0% |
| Obama | 182.1% |
| Trump | 69.6% |
| Biden | 58.0% |
| (as of December 4, 2024) | |
What next?
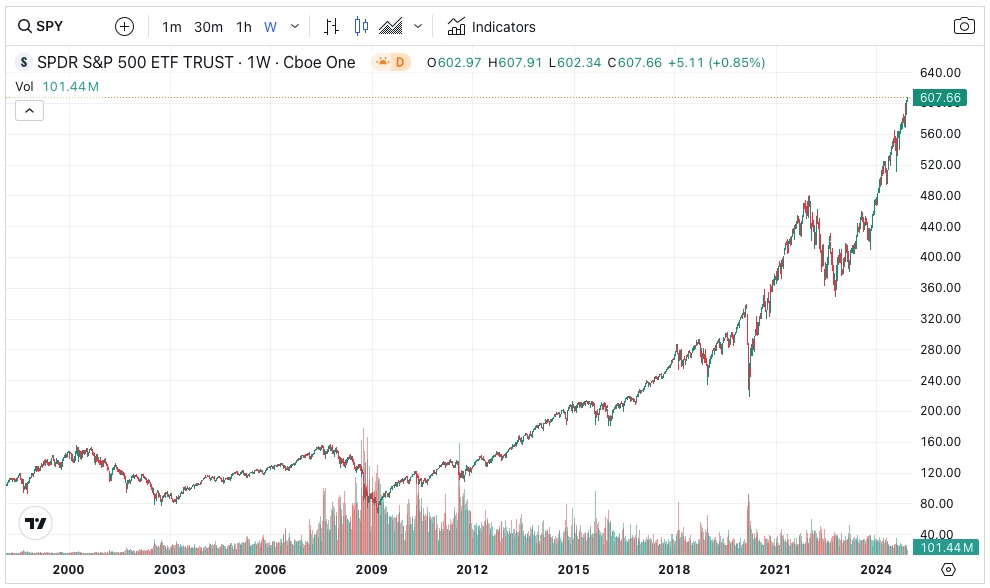
The question now is whether Trump II will bring about another spurt in equity prices. The trend in S&P and Dow are already very stretched. Look at the weekly chart of S&P (ticker SPY).
Undoubtedly, the index is amidst a roaring bull market. But its frantic pace of increase is too high to be sustained over the long term. A degree of caution is warranted as the market is discounting an extremely positive year ahead. This panglossian outlook, I suspect, may be too optimistic. And remember, the current rally started way back in late 2022. By the time Trump starts his second term in January 2025, prices would have been advancing for two full years. Can the bull market continue at this pace for another 48 months? I am not sure. Markets, as they say time and again, don’t growth to the sky. And financial prices certainly don’t move in a straight line (as it is right now)
In sum, stay the course (due to the momentum), but remember to take some chips off the table on further rallies. Protective stops may be put on to protect profits. Markets are unpredictable and you certainly do not want to watch all the gains vaporised on a correction. Who knows, we could in the ‘Buy the rumour’ phase and Trump’s inauguration could be the signal to ‘sell the fact.’


Jackson is a core part of the editorial team at GoodMoneyGuide.com.
With over 15 years of industry experience as a financial analyst, he brings a wealth of knowledge and expertise to our content and readers.
Previously, Jackson was the director of Stockcube Research as Head of Investors Intelligence. This pivotal role involved providing market timing advice and research to some of the world’s largest institutions and hedge funds.
Jackson brings a huge amount of expertise in areas as diverse as global macroeconomic investment strategy, statistical backtesting, asset allocation, and cross-asset research.
Jackson has a PhD in Finance from Durham University and has authored over 200 guides for GoodMoneyGuide.com.
To contact Jackson, please ask a question in our financial discussion forum.


