To buy shares in Vodafone Group Plc you will need a FCA regulated UK stock broker like AJ Bell, Hargreaves Lansdown or Saxo where it currently costs 115.08p to buy one share in Vodafone Group Plc (as of 17:20 02-Apr-2026). Which is a change of 1.43p or 1.26% from the last closing price of 113.65p.
How To Buy Vodafone Group Plc Shares
It may seem complicated to buy shares for the first time, but it’s actually very easy. Follow these simple steps to buy shares in Vodafone Group Plc:
- Pick a stock broker (jump down to compare the best brokers for buying Vodafone Group Plc shares)
- Deposit funds (via bank transfer or debit card)
- Search for the company share symbol: (LON:VOD)
- Choose the number of shares you want to buy (1 share currently costs 115.08p)
- Click buy (you can either trade immediately at “market” or set a “limit” to buy the shares cheaper if you think the price will go down)
- Track the performance of your Vodafone Group Plc shares in your account (this will show your profit and loss)
- Vodafone Group Plc is currently worth £34,875,754,377 based on the last closing price of 113.65p with 50,773,166 shares traded.
- The most recent Vodafone Group Plc daily high has been 115.55p and daily low 112.7p.
- The Vodafone Group Plc share price 52 week high has been 120.95p and the 52 week low 62.4p.
Compare Brokers For Buying Vodafone Group Plc Stock
You can buy these UK shares in a general investment account, and stocks and shares ISA where your profits are tax-free. Or if you are investing for your retirement, you can buy them in a SIPP, where profits are also tax-free but you cannot access the money until you reach 55.
| Name | Logo | GMG Rating | Customer Reviews | Annual Fees | Dealing Commission | CTA | Feature | Expand |
|---|---|---|---|---|---|---|---|---|
|
|
GMG Rating |
Customer Reviews |
Annual Fees 0% – 0.25% |
Dealing Commission £3.50 – £5 |
See Offers Capital at risk
AJ Bell Reviews |
Features:
|
AJ Bell Share Dealing ReviewProvider: AJ Bell Share Dealing Verdict: AJ Bell is a low-cost online investing platform and is the cheapest share dealing platform for buying and selling shares for the UK do-it-yourself (DIY) investor. They also offer plenty of investment ideas, including investment guides and equity research. Summary A great choice to deal shares with low costs in a variety of investment accounts.
Fees: AJ Bell share dealing account fees are capped at £3.50 a month. Dealing costs are £1.50 for funds and £5 for shares but drop to £3.50 when there were 10 or more online share deals in the previous month. Special Offers:
Pros
Cons
Overall4.2 |
|
 |
GMG Rating |
Customer Reviews |
Annual Fees 0% – 0.45% |
Dealing Commission £5.95 – £11.95 |
See Offers Capital at risk
Hargreaves Lansdown Reviews |
Features:
|
Hargreaves Lansdown Share Dealing Expert Review Account: Hargreaves Lansdown Share Dealing Description: Hargreaves Lansdown offers access to the widest selection of stocks for share dealing accounts in the UK. The platform also has one of the best research portals for analysing stocks. Is it expensive to buy and sell shares on Hargreaves Lansdown? Hargreaves Lansdown is not as expensive as it used to be as there is no account charge for holding shares in a general investment account and a max of £3.75 in a stocks and shares ISA. HL does still cost more than competitors like AJ Bell and Interactive Brokers to buy and sell shares, but the account running costs can be lower because of the monthly cap. HL won the Best Stock Broker in our 2024, 2022 awards, and in 2021, it won Best Full-service Stockbroker for their all-round approach to customer service.. Another added bonus of dealing shares through HL is that their clients benefit from price improvements for best execution. HL say they reach out to multiple brokers to get the best prices for a trade and clients can make a saving of £18 per trade on average. This is particularly relevant if you are dealing with cap UK shares, which is where Hargreaves Lansdown excels. Overall, Hargreaves Lansdown is an excellent choice for most types of share dealing on UK and international markets. Pros
Cons
Overall4.9 |
|
 |
GMG Rating |
Customer Reviews |
Annual Fees 0.4% – 0.08% |
Dealing Commission £1 – 0.08% |
See Offers Capital at risk
Saxo Reviews |
Features:
|
Saxo Share Dealing Review: Lower fees and professional grade techAccount: Saxo Share Dealing Description: Saxo’s platform has share dealing on more than 50 stock exchanges around the world with 22,000 shares available for investors. Making it one of the most diverse investment platforms for share dealing in the UK. Its forte is on the trading side for traders that need direct market access and are more price-sensitive to bid/offer spreads. Is Saxo any good for share dealing? Yes, you can deal shares directly on exchange with Saxo. In fact, Saxo is one of the best DMA brokers for trading shares inside the bid/offer price as you can place your orders directly on the order book. Saxo’s platform has share dealing on more than 50 stock exchanges around the world with 22,000 shares available for investors. Making it one of the most diverse investment platforms for share dealing in the UK. Its forte is on the trading side for traders that need direct market access and are more price-sensitive to bid/offer spreads. Saxo is a good share dealing platform for sophisticated and advanced investors who also need direct access to capital markets. Fees: Saxo Markets charges a share dealing commission based on a percentage of transaction size. They are very competitive though, and UK share dealing commission starts at 0.1% (£100 if you buy £100,000 worth of stock) and drops to 0.05% for more active traders. As Saxo is a prime broker with a retail and institutional client base, they are one of the best share dealing platforms for larger customers. However, there are some downsides. Firstly they do not offer acesss to smaller cap shares on their trading platform like brokers Spreadex and IG, who have a much braoder range of shares to trade online. Secondly, you cannot trade shares as financial spread bets (where profits are free of capital gains tax). Finally, the cost of dealing shares with Saxo is higher than with a broker like Interactive Brokers. But Saxo wins hands down when it comes to customer services, research and analysis. Pros
Cons
Overall4.3 |
|
 |
GMG Rating |
Customer Reviews |
Annual Fees £0 |
Dealing Commission £3 |
See Offers Capital at risk
Interactive Brokers Reviews |
Features:
|
Interactive Brokers Share Dealing ReviewProvider: Interactive Brokers Share Dealing Verdict: Interactive Brokers is an excellent account for sophisticated share dealers who want to manage their own portfolio with complex order types actively and need access to a wider range of investment products like derivatives, options, and futures. They also offer fractional share dealing if you only want to start trading a small amount. Summary One of the most advanced share dealing platforms for beginners and professional investors.
Fees: Interactive Brokers does not charge share dealing custody fees and minimum share dealing commissions are £1 in the UK or 0.05% of the deal size. Pros
Cons
Overall4.3 |
|
|
|
GMG Rating |
Customer Reviews |
Annual Fees £0 – £96 |
Dealing Commission £0 |
See Offers Capital at risk
IG Reviews |
Features:
|
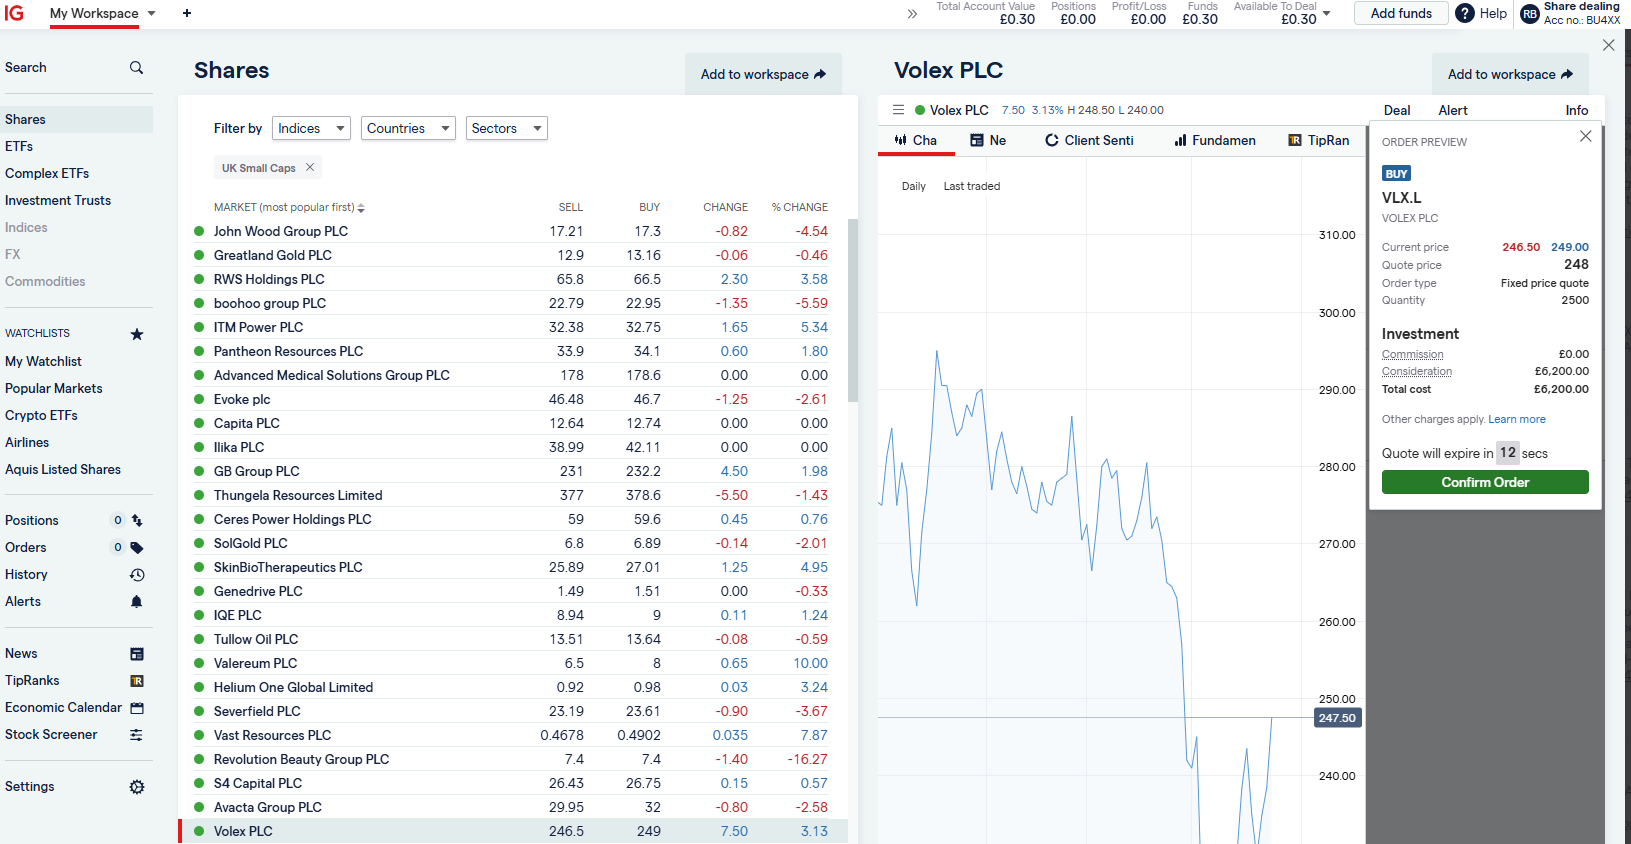
IG Share Dealing Expert ReviewIs an IG share dealing account any good? An excellent share-dealing platform for those who want to deal shares regularly in the short and long term. You also get access to a huge range of UK small-cap shares, where you can request quotes from marketmakers via RSPs. This is something that is not available from other trading/investing platforms like CMC or Trading 212. An IG share dealing account is different from a spread betting or CFD trading account in that you actually own physical shares as opposed to trading derivatives. The ability to deal in shares with IG means that you can invest in companies for the long term alongside your short-term higher-risk speculation. An excellent share-dealing platform for those who want to deal in shares regularly in the short and long term.
Pros
Cons
Overall4.4 |
|
|
|
GMG Rating |
Customer Reviews |
Annual Fees £59.88 |
Dealing Commission £3.99 |
See Offers Capital at risk
interactive investor Reviews |
Features:
|
Interactive Investor Share Dealing ReviewProvider: Interactive Investor Share Dealing Verdict: Interactive Investor is a low-cost share dealing platform that offers investors access to over 40,000 shares. II won the 2021 and 2023 Good Money Guide award for Best Investment Account. Summary Interactive Investor is a great choice for anyone who wants to buy and sell shares on a regular basis and has a large portfolio.
Dealing Fees: Interactive Investor share dealing commissions are a free trade every month, then UK Shares and Funds, US Shares charged £7.99 or upgrade to a £19.99 “Super Investor” account 2 free monthly trades and deal for £3.99. Regular investing is free. Special Offers:
Pros
Cons Fixed-fee expensive for very small share dealing accounts below £1,000
Overall4.3 |
Is Now A Good Time To Buy Vodafone Group Plc Stock?
- Vodafone Group Plc’s EPS (earnings per share) are 0.15. A high EPS indicates strong profitability but may already be priced in, while a low EPS could signal weak earnings or a turnaround opportunity, requiring industry comparison.
- Vodafone Group Plc’s PE (price earnings ratio) is 9.7. A low PE ratio may suggest undervaluation but could also indicate slow growth or risk, whereas a high PE ratio reflects high growth expectations but may signal overvaluation, necessitating a check on earnings sustainability.
The below Vodafone Group Plc share price analysis and market data includes key financials, earnings estimates, peer performance, dividends, news and a company profile that will give you an indication as to whether this stock is a buy, sell or hold. Subscribe to Good Money Guide Analysis for expert opinion on the latest investment opportunities.