Technical indicators are essential for traders to analyze market trends and price movements. This guide covers moving averages, ADX, Bollinger Bands, CCI, and RSI, explaining their roles in identifying trends, reversals, and market conditions.
Moving Averages
Moving averages are helpful in determining whether the market is in a strong uptrend, strong downtrend or is range bound. A market that is consistently above its n-period moving average is considered in an uptrend and therefore not suitable for range techniques. Likewise, one that tracks below its moving average is in a downtrend and not in a range. Moving averages are also helpful in showing where the mean lies for prices.
ADX
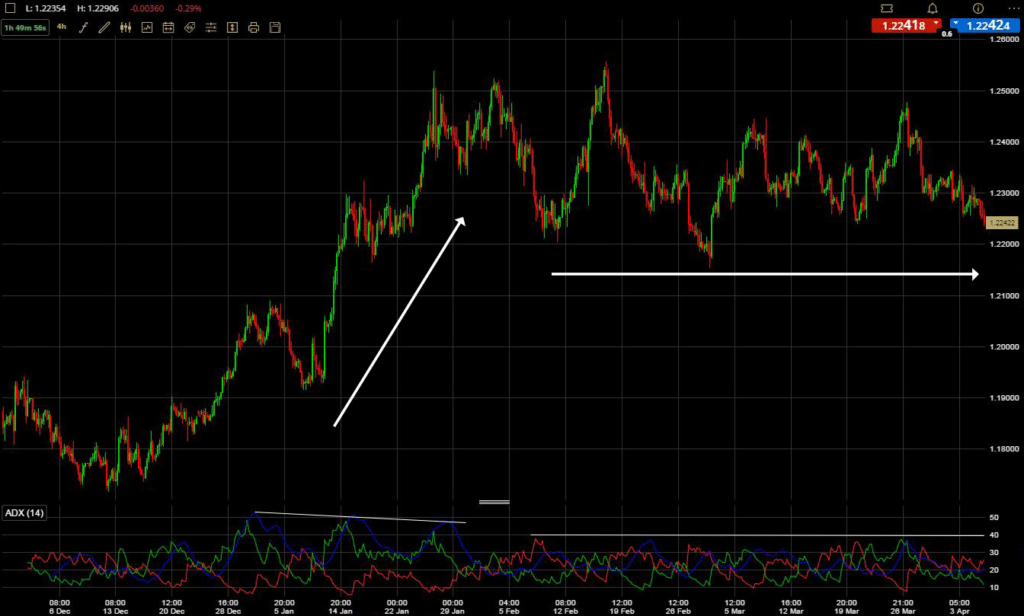
The Average Directional Index (ADX) helps to show whether a market is in a trend or not. The ADX line is plotted below the chart with values ranging from 0 to 100. A reading below 25 is generally considered to mean that there is no positive up or down trend in play. The below chart highlights where a strong trend was in play that was then followed by sideways movement.
EURUSD – decline in ADX off highs signals market moving sideways
Bollinger Bands
Bollinger Bands are particularly useful for range traders. First, the bands help define overbought and oversold conditions. As prices reach and then move beyond the upper and lower bands the market is becoming respectively overbought or oversold. Secondly, design prices to move between the bands, thereby helping to define price targets. Prices have a tendency to swing from one extreme to the other.
If price touches the upper band, a reasonable price target would constitute the lower band level. However, it is worth noting that prices are as likely to continue to move beyond the bands as they are to retrace back between the two bands. In other words, just because a market is overbought does not mean it cannot keep rising.
Traders should seek to confirm signals by looking at the price, chart formations, other indicators, candles patterns and established areas of support and resistance.
Finally, they can help predict a breakout. When the bands narrow, a sharp move in prices is expected, although the indicator does not predict in which direction that may be.
CCI
The Commodity Channel Index (CCI) was established to identify turning points in markets that move in cycles. It is also useful in helping to identify overbought and oversold conditions. Usually, this oscillates between -100 and +100, although it is unbounded, so can potentially go a lot higher or lower depending on the strength of the trend.
However, because this range is fairly common, in practice many traders only consider overbought and oversold conditions to be met when the indicator reaches +200/-200. As each market can vary in terms of its volatility, it is often wise to optimise, for instance by looking at historical trends to identify when a particular market moves beyond its usual limits. Using the CCI alone is clearly not enough – too many false signals can be given since, as we have previously noted, prices are as likely to continue rising when technically ‘overbought’ or continue falling when technically ‘oversold’.
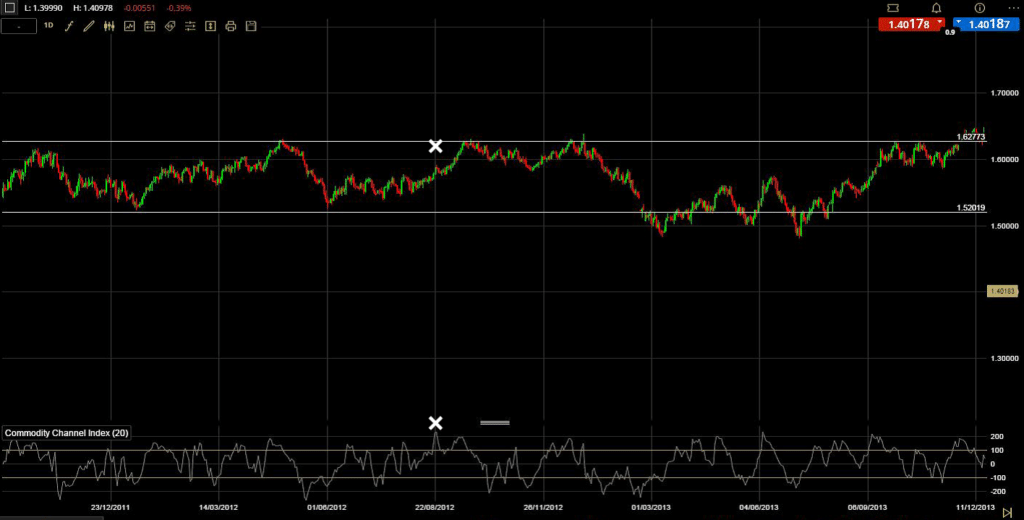
We must consider both the signals suggested by the CCI and the security’s price in relation to the range. For instance, if the market reaches an established resistance level and the CCI indicator as well above 100, and then starts to turn lower below the overbought line, then it may be a good time to open a short position.
GBPUSD – CCI and price signals
RSI
The Relative Strength Index (RSI) also produces signals based on overbought and oversold conditions. The RSI is a line oscillates between 0 and 100. Markets are said to be overbought if the RSI rises above 70 and oversold if it falls below 30.
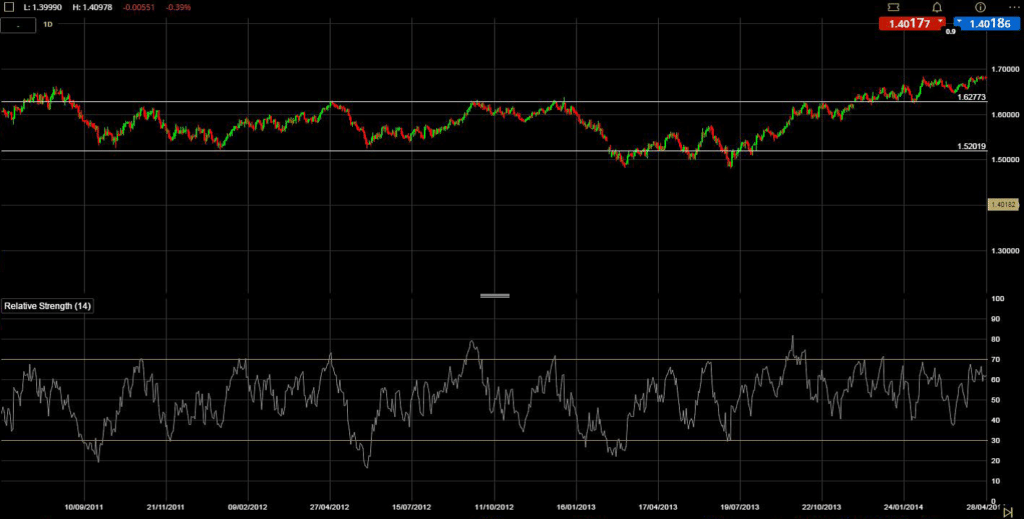
This can be modified to 80/20 for a market that is a strong trend. For the range trader, again we are looking for a market to be overextended – above 70 or below 30 – and for a turn in the RSI into the normal parameters, ie between 30 and 70. If this occurs as the price of the security reaches an established level of support or resistance it may be a good time to enter the market, with the expectation that the RSI is signalling a change in direction back into the middle of the range.
GBPUSD – RSI and price signals

Richard is the founder of the Good Money Guide (formerly Good Broker Guide), one of the original investment comparison sites established in 2015. With a career spanning two decades as a broker, he brings extensive expertise and knowledge to the financial landscape.
Having worked as a broker at Investors Intelligence and a multi-asset derivatives broker at MF Global (Man Financial), Richard has acquired substantial experience in the industry. His career began as a private client stockbroker at Walker Crips and Phillip Securities (now King and Shaxson), following internships on the NYMEX oil trading floor in New York and London IPE in 2001 and 2000.
Richard’s contributions and expertise have been recognized by respected publications such as The Sunday Times, BusinessInsider, Yahoo Finance, BusinessNews.org.uk, Master Investor, Wealth Briefing, iNews, and The FT, among many others.
Under Richard’s leadership, the Good Money Guide has evolved into a valuable destination for comprehensive information and expert guidance, specialising in trading, investment, and currency exchange. His commitment to delivering high-quality insights has solidified the Good Money Guide’s standing as a well-respected resource for both customers and industry colleagues.