Bank of England in Two Minds about Interest Rates
The Bank of England MPC is utterly perplexed by the British economy. The August 7 monetary meeting was an extraordinary one. The nine-member MPC held two votings to decide whether the policy rate should be lowered. Four, plus one, voted ‘yes’ to a rate cut; the other four said ‘no’.
In the end, the Base Rate was cut by 25 basis points (0.25 percent) to 4 percent. This is the fifth reduction in borrowing costs since mid-2024, a reduction that pulls the rate down to the level last reached in early 2023.
The chart below shows the rise and fall of the Base Rate in recent years. The central bank calls the current regime a disinflationary phase.
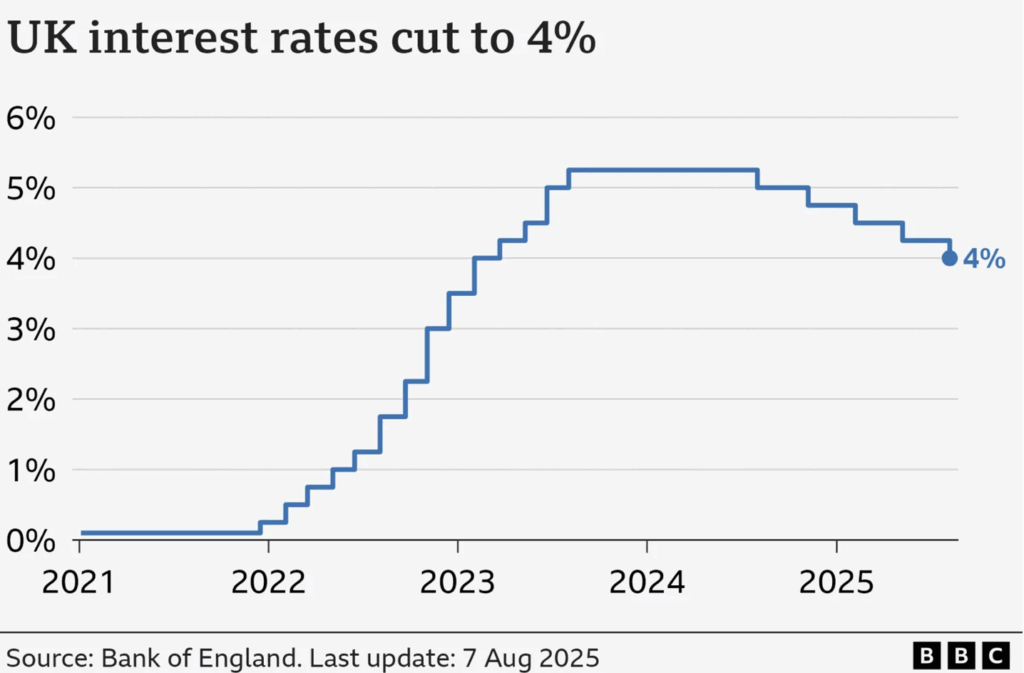
Source: BBC/Bank of England
So, why are MPC members in such a stark disagreement? Their diverging views stem primarily from the fast-changing world economy. Who can blame them? In a tariff-laced macro environment, most economists are scratching their heads when analysing inflation, growth rate, or macro trends.
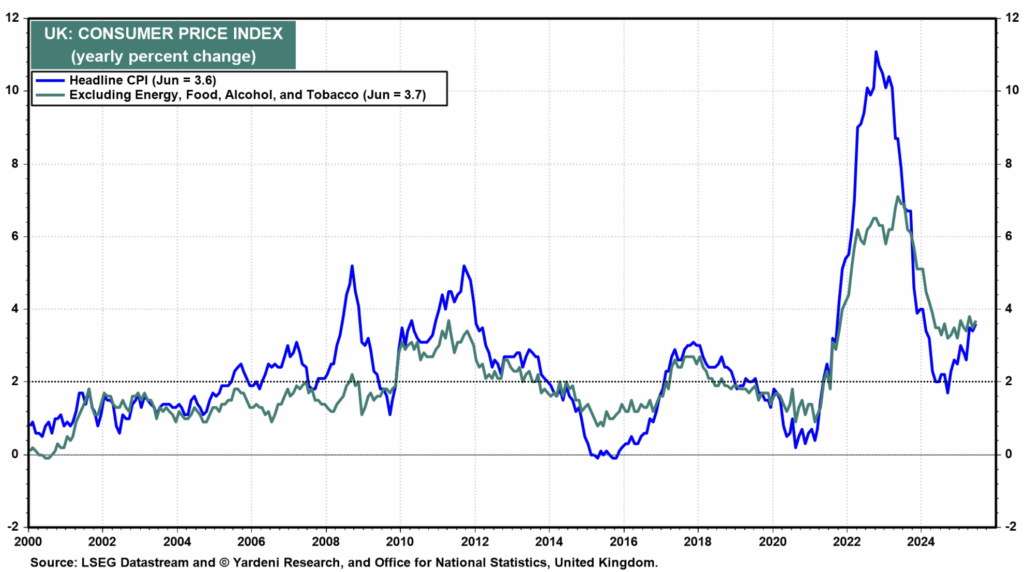
Take inflation. Since early 2025, UK Headline CPI has rebounded more than expected (see below). June readings touched 3.6 percent, which is the highest level since early 2024. At times, it was a rebound in energy prices that caused it. In other periods, it was the service sector.
In economy, big trends grow from small – but persistent – trends. The central bank has taken some flak over its ‘slowness’ in tackling inflation in 2022 when it was still low. This time, the MPC does not want to repeat the same mistake. Better be sure that inflation is completely stable before acting decisively
Here a bullet point summary of the UK economy (see entire BoE discussion here):
- Subdue UK economic activities, with moderating pay growth
- Some upside risks to inflation rates, putting disinflationary trend at risk
- Financial volatility is stable/lower (bullishness in stocks noted)
In other words, the British economy is shifting rapidly in an unpredictable manner. That is the challenge for policymakers in the next few quarters. In Rumsfeld-speak, the world is locomoting into phase with a number of “unknown unknowns”.
Source: Yardeni.com
Mega-Cap stocks Extend Bull Run
Despite the turbulent real economy at the moment, stocks continue to be the asset of choice by many institutional investors. It brings predictability and, more importantly, juicy returns.
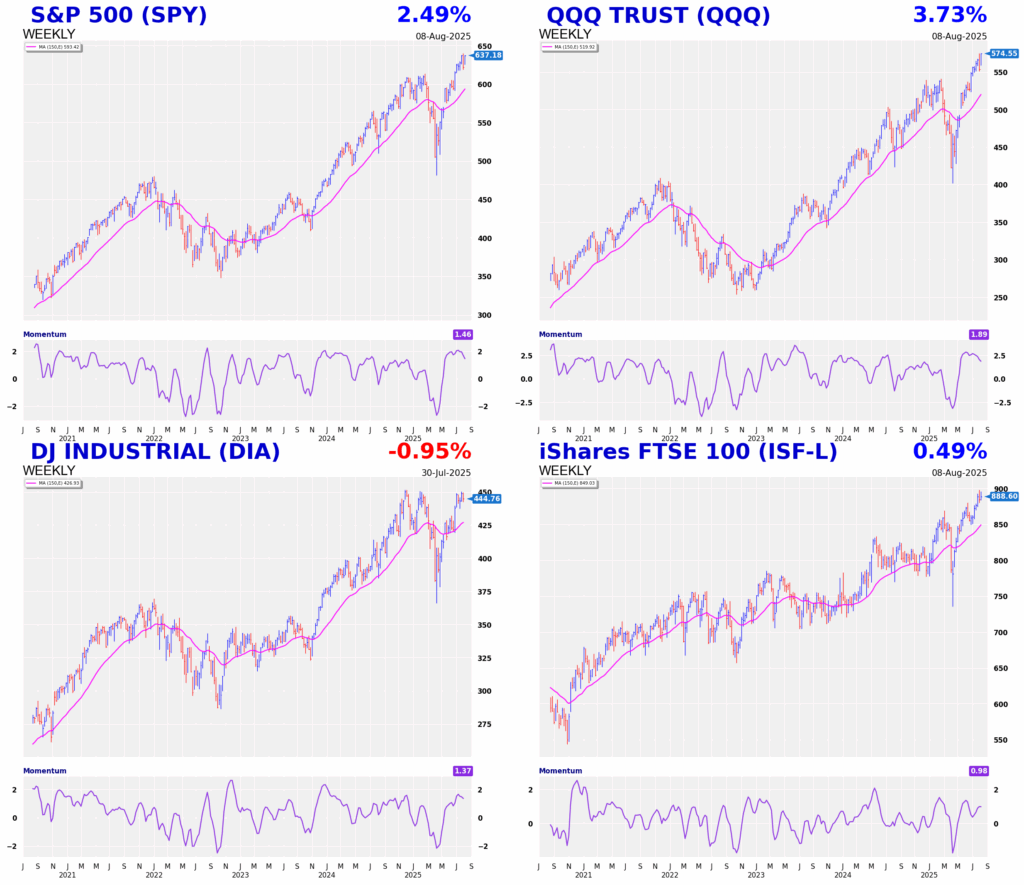
In the US, all key indices powered to their highest levels, again. The S&P 500, Nasdaq 100 and Dow are flirting with record highs. Even the FTSE 100, which despite the drag of the UK economy, stays at elevated levels (see below).
While stock charts can be deceiving at times, due to unpredictable macro policies and volatile investor sentiment, the trend they represent cannot be ignored. Stock trends are a distillation of the crowd’s overall forecasts (‘crowd wisdom’ as they called it). At this point, most investors are painting a rosy picture for corporate earnings, which, in turn, rests on a benign and growing economy.
As an investor, the most critical job is to stay invested with the bull trend, for as long as possible, until the chart tells us otherwise.
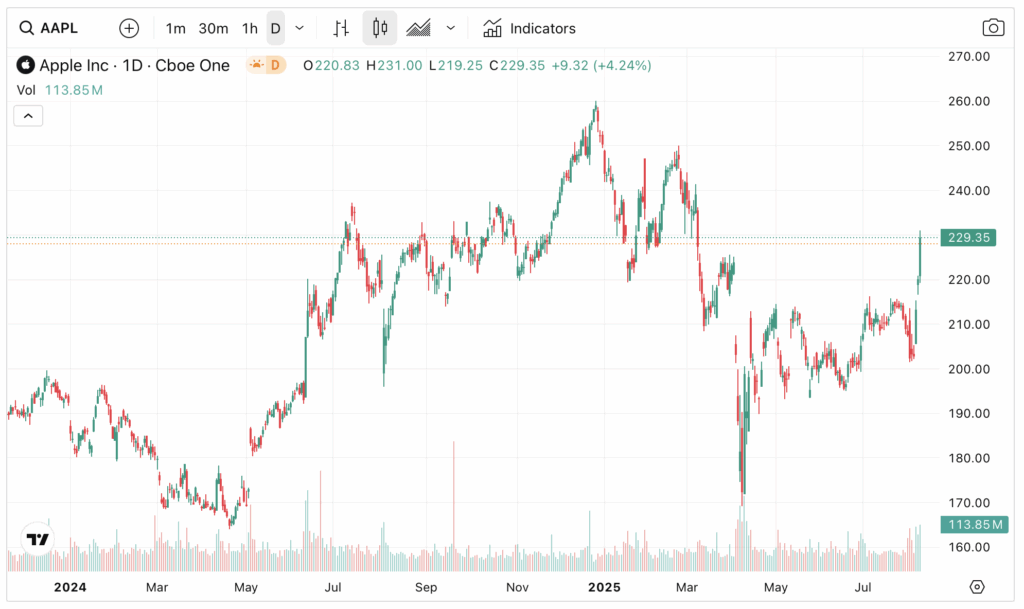
One of the biggest contributors to S&P’s rally last week was Apple (AAPL).
The tech stock was mired in a choppy correction – a correction that saw prices slumped by a third from its all-time high of $260. But last week’s 12 percent rally probably ended this frustrating phase.
Perhaps it was the announcement that Apple will invest $600 billion in the US over the next four years that changed investor expectations. Or perhaps it was Apple’s reassuring earnings ($94 billion last quarter, up 10 percent) that laid the foundation of a rally. Whilst bullish near term, it is still an open whether prices can sustain a rally into record highs. Near-term support is noted at $215.
The other tech stock that remains steadfastly bullish is Nvidia (NVDA). The world’s largest stock by market cap ($4.4 trillion!) continues to sit at new all-time high. So powerful is its rally that even the recent 15 percent revenue deal with the White House fail to dent the stock much.
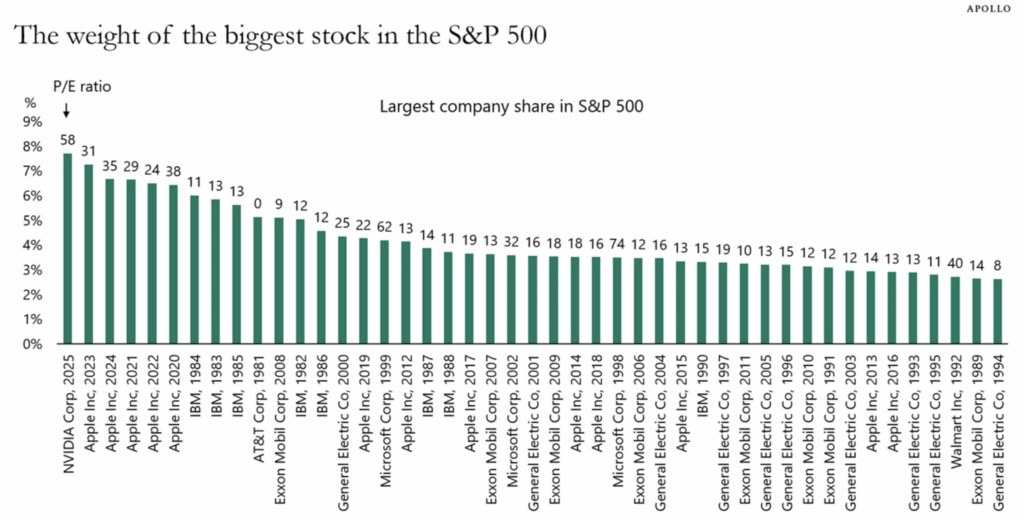
Interestingly, Torsten Slok of Apollo did some number crunching on NVDA’s market cap relative to the S&P 500. What he found is intriguing and relevant to all US investors.
Look at the chart below. Not only is Nvidia the largest component member in the S&P right now, its weighting (>7 percent) is the largest weighting of the S&P since 1980. Mega-cap about to turn hyper-cap.
How long can NVDA maintain this dominance? In stock markets, strength begets strength. Apple was the largest US stock during 2020-2024, until it was superseded by Nvidia’s astounding rise. History suggests that with the right momentum, Nvidia can stay at the apex for some time.
Source: Apollo (Aug 2025)

Jackson is a core part of the editorial team at GoodMoneyGuide.com.
With over 15 years of industry experience as a financial analyst, he brings a wealth of knowledge and expertise to our content and readers.
Previously, Jackson was the director of Stockcube Research as Head of Investors Intelligence. This pivotal role involved providing market timing advice and research to some of the world’s largest institutions and hedge funds.
Jackson brings a huge amount of expertise in areas as diverse as global macroeconomic investment strategy, statistical backtesting, asset allocation, and cross-asset research.
Jackson has a PhD in Finance from Durham University and has authored over 200 guides for GoodMoneyGuide.com.
To contact Jackson, please ask a question in our financial discussion forum.

