VWAP, which means volume-weighted average price is an excellent order type that can help traders buy or sell large positions along with the market instead of on a fixed price or time. In this guide we cover what VWAP trading is, how it can benefit your trading and show a selection of brokers that offer VWAP execution.
What is VWAP?
VWAP, which is a contraction of volume-weighted average price, is a metric that has become increasingly important, in the markets, since trading became screen-based and electronic.
VWAP allows traders, and those executing orders, to benchmark their execution against the broader market.
However, VWAP can also shed light on the dynamics within price action, by highlighting where liquidity can be found in a stock, and perhaps just as importantly, where it can’t.
How is VWAP calculated?
VWAP is calculated using the cumulative total of the price of each trade. That’s then multiplied by the volume of that trade, and finally divided by the total volume traded for the day.
The value of VWAP varies with every trade that’s made and, thanks to the volume weighting, larger trades have a bigger impact on the value of VWAP.
Best Brokers for VWAP trading
VWAP and VWAP trading used to be the preserve of those with access to level two and market-depth data. However, in recent years the indicator has become far more freely available thanks in no small part to the rising popularity of charting platform Trading View, which is now commonly integrated into many brokers’ offerings.
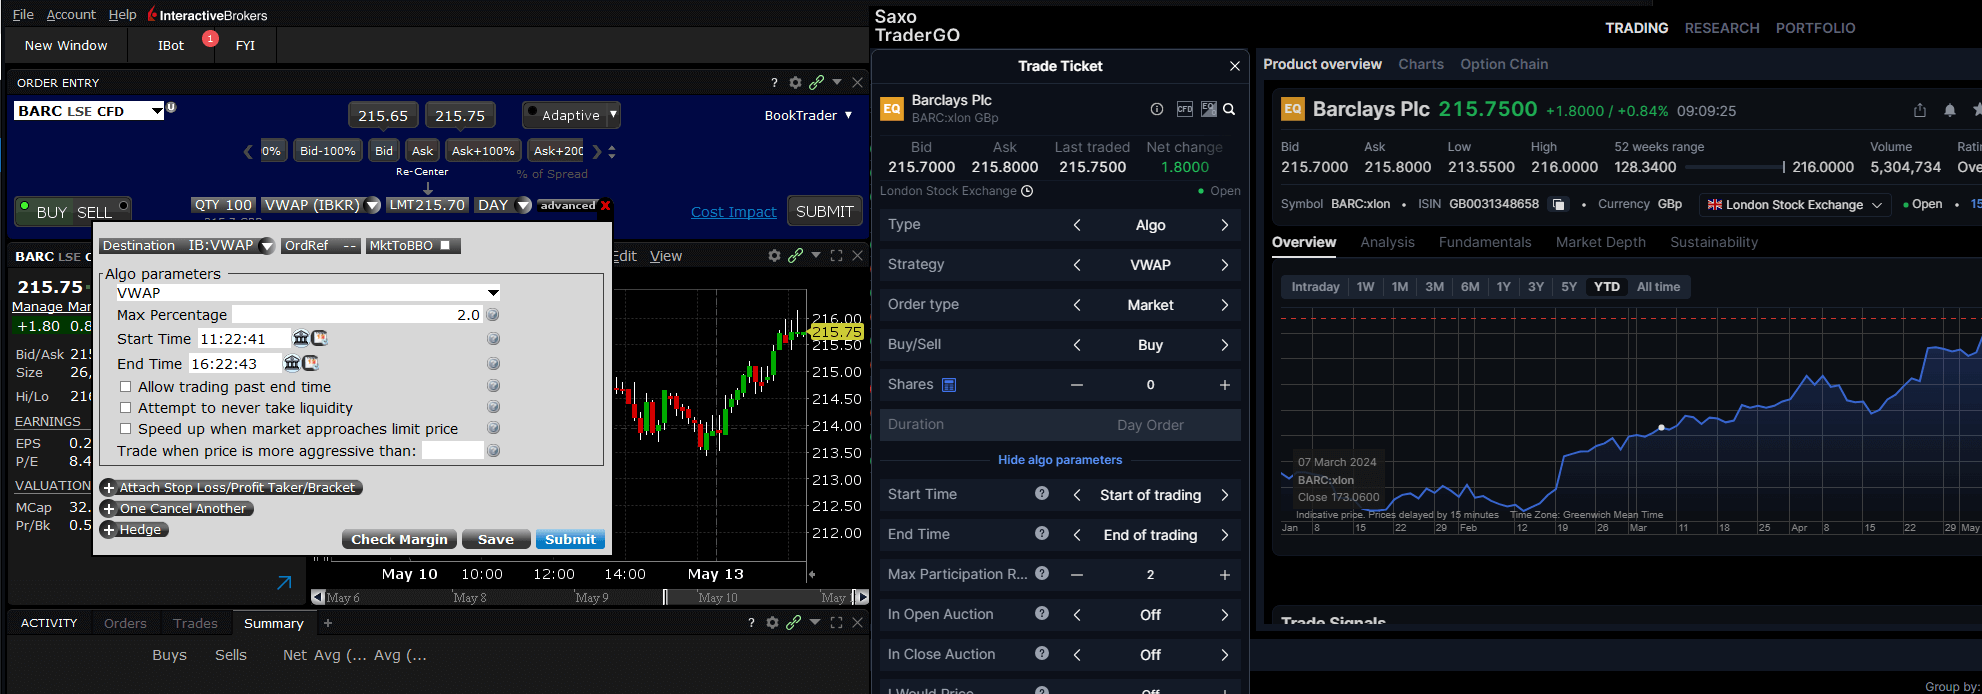
You can trade VWAP directly with brokers like Saxo (see screenshot below) or Interactive Brokers or you can connect your account with brokers like Pepperstone, Spreadex and City Index to TradingView and use their VWAP indicators for execution.

Compare VWAP Brokers on TradingView
| TradingView Broker | TradingView Markets | TradingView Score | TradingView Reviews | TradingView Traders | DMA | Spreads | More Info | Risk Warning | |
|---|---|---|---|---|---|---|---|---|---|
 | 13,500 | 4 | 169 | 2000 | ❌ | ✔️ | (Based on 124 reviews)
| See Platform 71% of retail investor accounts lose money | |
 | 5,000 | 4.6 | 12,200 | 127,600 | ❌ | ❌ | (Based on 16 reviews)
| See Platform 76% of retail investor accounts lose money | |
 | 1,200 | 4.4 | 22,300 | 104,200 | ❌ | ✔️ | (Based on 86 reviews)
| See Platform 75.3% of retail investor accounts lose money | |
 | 7,000 | 4.4 | 21,300 | 162,600 | ✔️ | ❌ | (Based on 934 reviews)
| See Platform 60% of retail investor accounts lose money | |
 | 10,000 | 3.9 | 54 | 515 | ❌ | ✔️ | (Based on 257 reviews)
| See Platform 64% of retail investor accounts lose money | |
 | 9,000 | 3.9 | 1,400 | 17,700 | ✔️ | ❌ | (Based on 73 reviews)
| See Platform 65% of retail investor accounts lose money |
How and why traders use VWAP in their trading?
VWAP be used as a benchmark, against which to measure the quality of execution in say a large buy or sell order.
For example, an institution might ask a broker to buy a quantity of a particular stock and instruct the broker to match the VWAP over the next couple of hours, as they do so.
In effect, the institution is trying to ensure that they don’t chase the price of the stock higher or lower, but rather trade it in line with natural market activity.
However, VWAP can also be used in other ways by traders
For example, VWAP shows us where liquidity can be found in a stock because it highlights the prices at which buyers and sellers were matched off.
We can think of VWAP as being akin to a moving average of liquidity within a stock.
Knowing where liquidity can be found can provide traders with insight into entry and exit levels, or highlight zones of supply and demand within a stock’s price action.
VWAP can also be used as a gauge of momentum. Particularly when it is plotted on a chart with price and other indicators, such as moving averages.
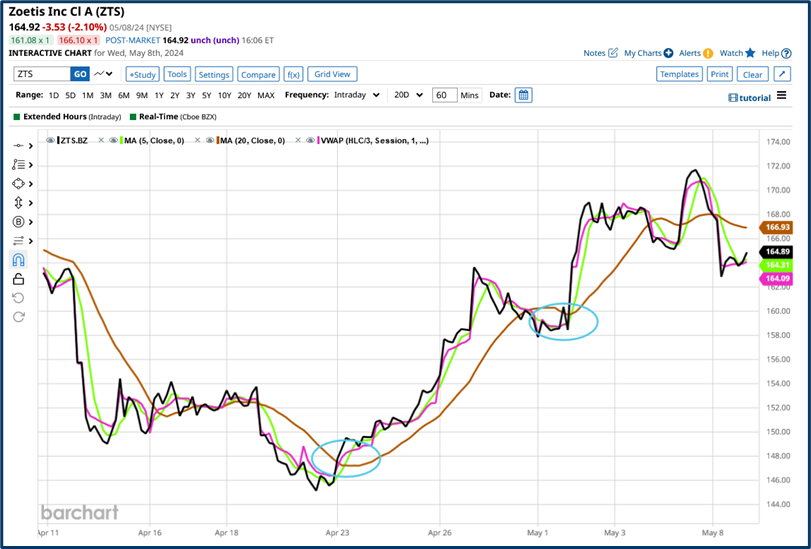
For example, in this chart of US veterinary supplies company Zoetis (ZTS).
We see the price in black, plotted against the 5 and 20-period moving averages, in green and brown, with VWAP displayed in magenta.
I have highlighted two points at which price, VWAP, and the 5-period MA line, cross up through the 20-period MA line.
In both cases,, the price of ZTS moves higher thereafter.
A rising VWAP implies a greater demand or urgency to own the stock.
That in turn pushes the price higher, to a level at which sellers are attracted back into the market, the excess demand is met by supply and the price slips back.
Being able to identify the changes in demand and the peaks and troughs in the price action that result from that, is a potentially lucrative skill set for a trader.

Source: barchart.com

With over 35 years of finance experience, Darren is a highly respected and knowledgeable industry expert. With an extensive career covering trading, sales, analytics and research, he has a vast knowledge covering every aspect of the financial markets.
During his career, Darren has acted for and advised major hedge funds and investment banks such as GLG, Thames River, Ruby Capital and CQS, Dresdner Kleinwort and HSBC.
In addition to the financial analysis and commentary he provides as an editor at GoodMoneyGuide.com, his work has been featured in publications including Fool.co.uk.
As well as extensive experience of writing financial commentary, he previously worked as a Market Research & Client Relationships Manager at Admiral Markets UK Ltd, before providing expert insights as a market analyst at Pepperstone.
Darren is an expert in areas like currency, CFDs, equities and derivatives and has authored over 260 guides on GoodMoneyGuide.com.
He has an aptitude for explaining trading concepts in a way that newcomers can understand, such as this guide to day trading Forex at Pepperstone.com
Darren has done interviews and analysis for companies like Queso, including an interview on technical trading levels.
A well known authority in the industry, he has provided interviews on Bloomberg (UK), CNBC (UK) Reuters (UK), Tiptv (UK), BNN (Canada) and Asharq Bloomberg Arabia.
You can contact Darren at darrensinden@goodmoneyguide.com


