Every now and then (four years to be exact), the presidential race electrifies America’s political scene. Live debates, nomination discussions and endless on-the-road campaigns bombard every US citizen day and night. By November, most voters wish to wrap the whole issue up.
A macro issue as important as this often moves asset prices. Who captures the White House matters. However, there are numerous polls to guide market expectations in the run-up to the actual results. Yes, elections do surprise. But seldom on the scale of the Brexit referendum.
Nearly all US presidential candidates came from one of the two parties: Republican (the red corner) and Democrat (blue). Currently, the US president is Joe Biden (46th, Democrat). Over the summer, due to health concerns, the octogenarian commander-in-chief ceded the presidential race to a younger colleague, Kamala Harris. She is currently the vice president of the United States. Her Republican opponent in the 2024 election is the 45th president, Donald Trump.
Who is winning the race? According to the polls, it appears the Democratic candidate is leading (see below). More importantly, the US stock market indices are in a firm bull trend. New all-time highs for the blue-chip S&P 500 Index in early October favour the leading contender and the incumbent party.
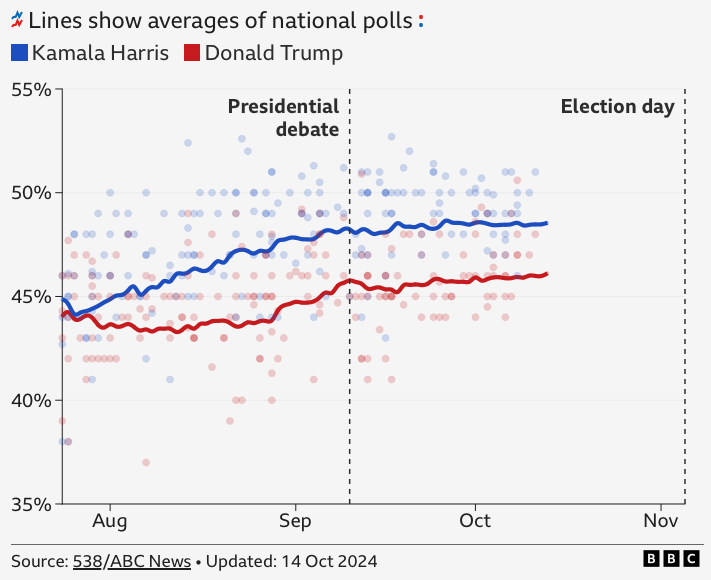
Source: BBC
How have previous US elections affected the stockmarkets?
Historically, however, does it really matter which party candidate captures the presidency? With a quick glance at the chart below, can you, for instance, which political party is better for stock market performance? Hard to pinpoint exactly which party is more bull market-friendly, I must admit.
Big bull markets happened in both colours, really. During the Reagan years (red), markets soared. While under Clinton, Obama and Biden (blue), markets rebounded mightily as well, following some unexpected corrections in the early years of their presidencies. Therefore it is hard to say (casually) which party is bullish on stocks.
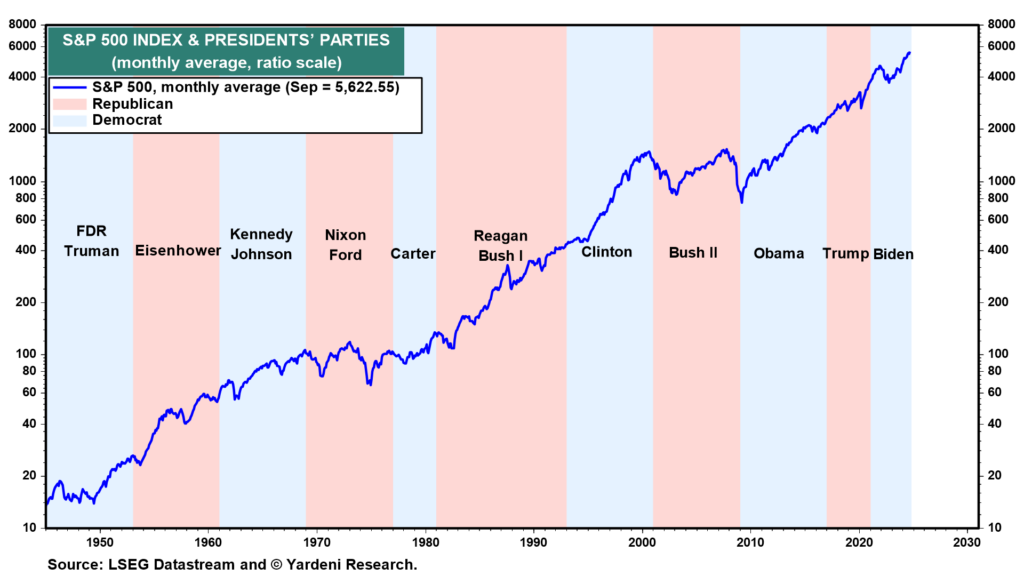
Source: Yardeni.com
However, if we separate each presidential term by date and analyse the performance data term by term, some say the Republican Party is better for the stock markets. Twice as good, says Morgan Stanley. Using the S&P 500 as a market proxy, the average return for a Republican president is 15.3 percent, compared to 7.6 percent for a Democrat (see below). This is a fair and wide margin.
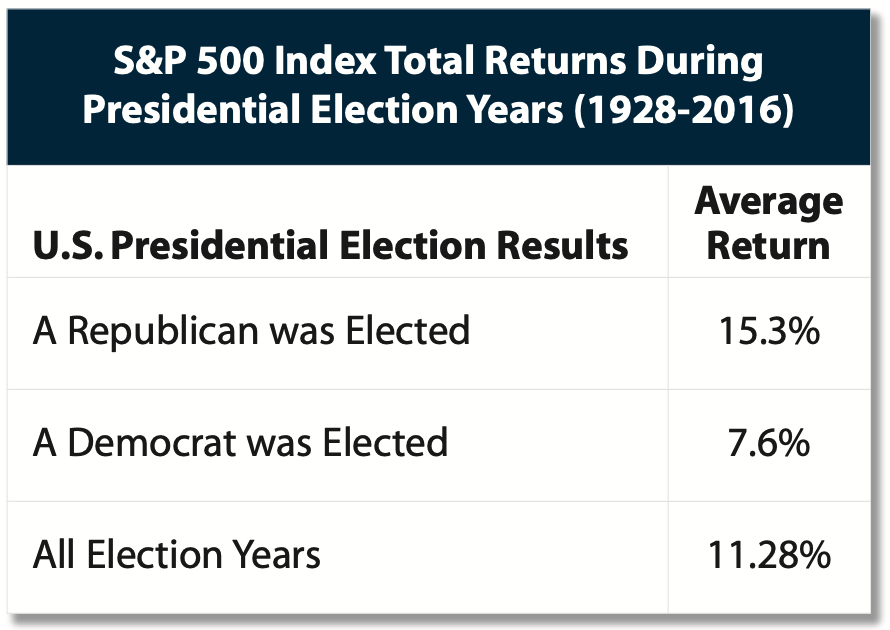
Source: Morgan Stanley (2024)
Is the US Presidential Cycle tradable?
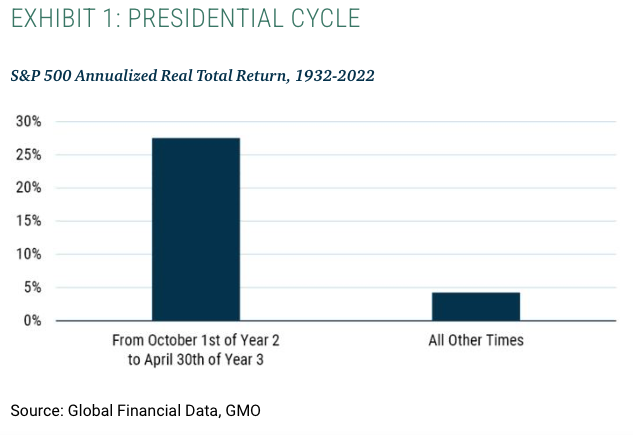
Another point about the presidential election concerns the Presidential Cycle. Leaders are tempted to spend more ahead of the election to improve (or ‘juice’) the economy. In turn, the electorate may be imbued with the ‘feel good’ factor and vote for the current party. In the US, the cycle runs like this. In the early years of a presidential term, stock returns are lower. Then stock prices rise in the second/third year and then tapered off in the last. The fund house GMO did several studies about this and found that during the Year 3 of a presidential term, stock returns are relatively higher than other periods combined. The founder of GMO concluded that:
The important fact here (see Exhibit 1) is that for 7 months of the Presidential Cycle, from October 1st of the second year (this cycle, 2022) through April 30th of the third year (2023), the returns, since 1932, equal those of the remaining 41 months of the cycle! This has a less than one-in-a-million probability of occurring by chance, pretty remarkably, and it has been about as powerful in the last 45 years as the previous 45 years.
In other words, perhaps who occupies the White House is less important than what happens after the presidency begins.
Source: GMO (2022)
Do US Presidential Elections impact FX markets?
The direct effect of the US election cycle on the international currency market is murkier. Two reasons complicate the analysis in the foreign exchange markets. The first is that all FX rates are relative comparison between two sovereign nations. Some pairs may appreciate; while others decline. The directional trend of each FX rate depends on a relative comparison of the economic strength of two countries. The US economy and political cycles are stacked on only one side of the equation.
The second factor is interest rates. Again, this depends on the economic performance of the two countries at that time. Other countries may be experiencing financial crises that makes the US Dollar more attractive, regardless of who is winning the US election. One example is the Global Financial Crisis in 2008. Furthermore, central banks these days have greater operational independence. This means more monetary policy continuity than in the past. Many Fed chairs’ term in office spread across presidencies of different parties. This blurs the impact of party-effect on FX rates.
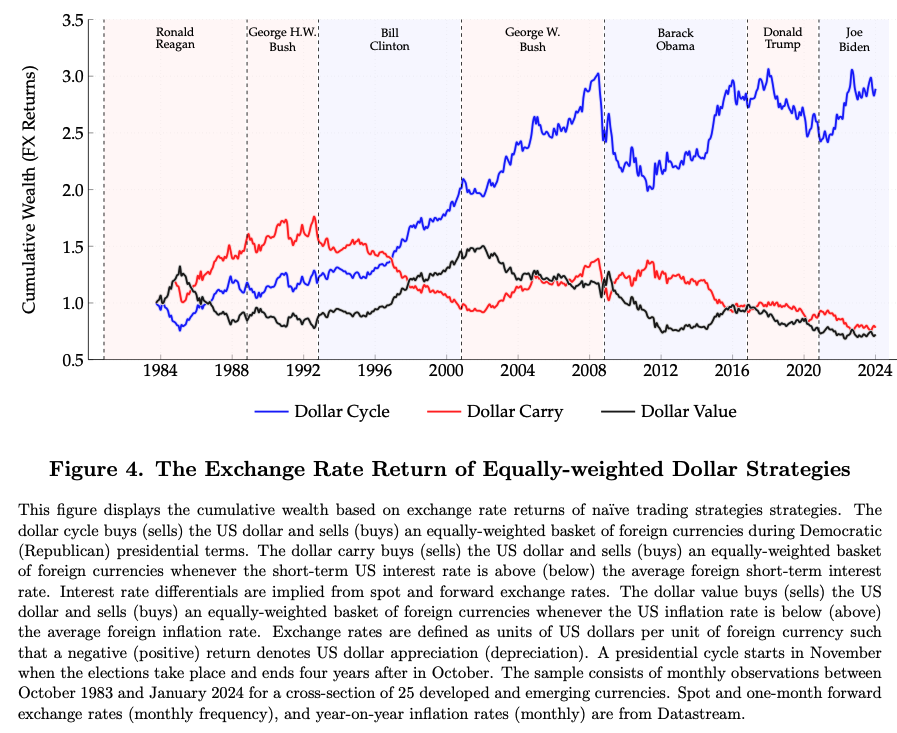
Still, some studies have been done on the impact of the US elections on USD pairs. In one, Corte and Fu (2024, link to paper) analyse the impact of political parties on the USD strength. They found that:
US presidential cycles can predict dollar-based exchange rate returns. Armed with more than 40 years of data and a large cross-section of currency pairs, we document an average US dollar appreciation during Democratic presidential terms and an average US dollar depreciation during Republican presidential mandates. The difference in these average exchange rate returns is larger than 5% per annum and is primarily linked to trade tariffs.
Note that the returns in the paper are aggregated across all Democratic and Republican terms. Whether or not this higher Democrats-enhanced return can be projected into a new presidential term is difficult to say. The authors did try to use simple FX trading strategies to assess impact of US parties on USD performance (see below, perhaps see the original paper for a further exposition).
Source: Cortes and Fu (2024)
Concluding Remarks
The US election is an important macro factor that sways asset prices. However the impact of each election cycle is different. Just because X or Y rallied in the last election does not mean they will do so again. The only consistent observation regarding the US presidential terms is the Presidential Cycle.
For traders, the important thing is not so much, who is winning, but what the market’s reaction to the looming presidency. Remember the stock market already incorporates, or ‘bakes in’ so to speak, much of the current and near-term information. With less than a month to the US election, the S&P is hitting new all-time highs. This ought to tell us something. The market senses that the next occupant of White House will be good for the market. Follow the trend.

Jackson is a core part of the editorial team at GoodMoneyGuide.com.
With over 15 years of industry experience as a financial analyst, he brings a wealth of knowledge and expertise to our content and readers.
Previously, Jackson was the director of Stockcube Research as Head of Investors Intelligence. This pivotal role involved providing market timing advice and research to some of the world’s largest institutions and hedge funds.
Jackson brings a huge amount of expertise in areas as diverse as global macroeconomic investment strategy, statistical backtesting, asset allocation, and cross-asset research.
Jackson has a PhD in Finance from Durham University and has authored over 200 guides for GoodMoneyGuide.com.
To contact Jackson, please ask a question in our financial discussion forum.

