A popular short/medium term reversal signal, where a stock reverses after posting an “outside day”. Particularly powerful when occurring on trend lines, after an overstretched rise/decline or at prior sideways activity levels.
UK Shares with Key Day Reversals Signals
Chart Characteristics That Precede Reversals and Trend Changes
Catching the peak and buying the bottom are stuff of dreams for many investors. How many traders do you know sold the Nasdaq on Mar 10, 2000, or bought the market on Mar 9, 2009? Very few. In fact, it is so difficult that one should be discouraged from ‘peak catching’. A better speculative method is to act as the trend changes, or, after a trend has peaked.
The question is: How does one assess that a trend’s character has changed? Over the short term, price fluctuations are pretty random. Over the long term, a trend change is fairly distinguishable. In this article, I summarise three chart characteristics that often precede a trend change.
Trend Acceleration
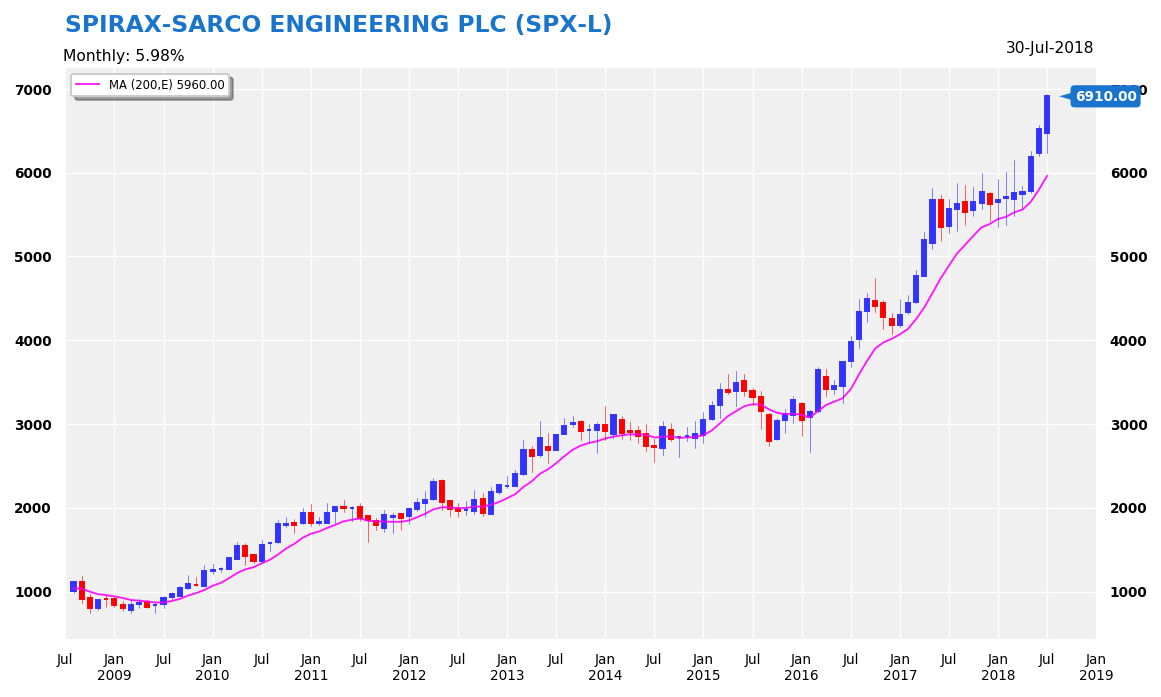
One reliable trait that suggests a long-term trend is fulfilling its potential is trend acceleration. What, exactly, is price acceleration? I defined it as a sudden, substantial, and sustained price rise outside its norm. Very often, price acceleration comes at the end of its long-term bull move.
Why is trend acceleration an ending signal? Because the price acceleration pulls forward all the stock’s future buying potential. When the last buyer has bought, there is no new buyer. Prices can only go one way – down.
I turn to a concrete example. With just a quick glance at Spirax Sarco Engineering PLC, are you detecting a whiff of price acceleration? Prices gained 1,000p in less than 10 weeks. Previously, SPX took twice as long. If history is of any guide, SPX may find some selling pressure at 7,000p or 8,000p after such a hefty rise. Note, too, the length of Spirax’s bull trend, which lasted almost a decade! Very few stock advances last this long.
Imagine what is happening as prices rise relentlessly for a decade. One, almost all the bears are squeezed out. Two, who’s left? Only the bulls! Investors are conditioned to buy this stock and not sell. It is likely that Spirax’s rally may prolonged.
It would be very interesting to see what happens to SPX a year from now.
Trend Anomalies
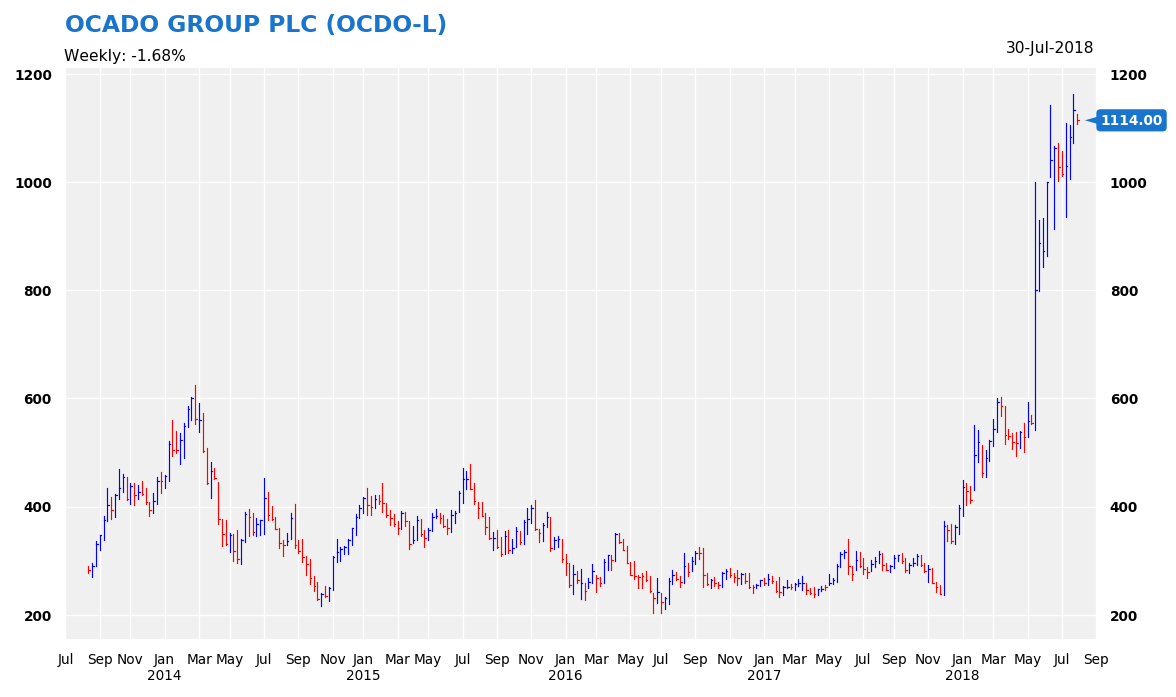
Once a trend is in motion, it is usually consistent (see chart above). Corrections tend to be shallow and short. But once instability sets in, you know something is not right. I call these minor chart facts trend ‘anomalies’.
Why are these anomalies important? Because they usually precede a major move – either a breakout or trend reversal. Did you see Ocado’s sharp share price rally in late 2017 that took the stock above its multi-year trading range? Once above 300p, the stock never traded below this level again. The Nov-’17 rally was such an anomaly because of its (a) size, (b) technical significance (range breakout; weekly dynamic), and (c) higher-high pattern. Clearly someone knew something good is about to happen.
The last time Ocado put a sizeable weekly rally was in Nov-’15, which led to a multi-week advance to 400p.
Therefore, some technical anomalies that you should watch out are: (1) Strong counter-trend prices, and (2) Accompanied by price gaps, or breaks of key support/resistance levels.
Massive Shakeouts
Boom and bust is an integral part of the market. It gives rhythms to prices. Even within a bull market, not all sectors are participating. Thus, whilst Ocado is on fire, outsourcing/retail/utilities stocks are sinking.
Massive shakeouts open the door for some bargain hunting. When bargain hunting, you would have to watch for three technical behaviours:
(a) Loss of Downward Momentum – When a bear trend is motion, stand aside. As the trend losses momentum, be prepared.
(b) Positive Catalyst – Equity dilution, bankruptcies, and forced mergers are distress signals. Once this is over, you will have some green shoots – although these positive developments may be covered by the continuing bearish sentiment.
(c) Upward Dynamics – Depressed prices can move hugely (20-100%) over a short period. These upward dynamics will tell you that changes are afoot. The thing to bargain hunting is this: You have to be quick. Why? Buy at 5p or 10p will make a huge difference to your return if prices go to 50p. You can work out the difference in returns.
Conclusion
Price trends change all the time. More importantly, they give clues when they change. This week, I discuss three trend behavioural traits that often precede a trend change.They are accelerations, anomalies, and big shakeouts. Rather that spending the effort to find the exact peak or trough, I think it is better to concentrate on the trend flows.
Other UK shares trading signals:
- Shares that have recently had a daily breakout
- Shares that have recently climaxed (either at the top or bottom of a range)
- Shares that have recently displayed a “hi-lo” pole
- Shares with an overextended point and figure spike or tail
- Shares with a recent moving average crossover
- Shares that are trading at 52-week highs
- Shares that a trading a 52-week lows