ETX Capital’s award-winning TraderPro platform was relaunched last year with full HTML 5 functionality and boasting a range of new features.
Here’s a quick look at three features you may have missed…
In-chart trading
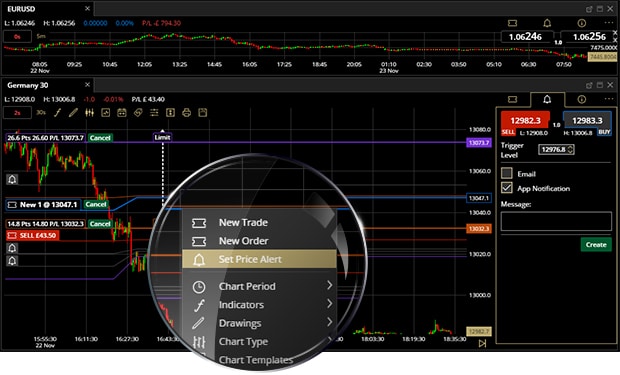
You can now carry out virtually all your trading from within the charts. These innovative new design features make it possible to set stops and limits, place orders, set up alerts and trade directly from the chart itself.
Stops & Limits
You can amend stops and limits by moving the horizontal bars up or down to the level at which you wish the stop or limit to be triggered. The horizontal bars are coloured purple for a limit order, orange for a stop.
Shaded grey areas will help show you the levels at which you can place your orders – outside the grey areas are where your stops and limits will be possible. As you select the bar to move it, the whole section between the live price and the stop/limit is highlight either purple or orange.
If you do not have an open trade on a market you can place orders from the chart directly, by right-clicking and selecting ‘New Order’. Once you click ‘Place’, a blue horizontal buy line or a red horizontal sell line will appear on the chart at the price you wish to execute the order.
And now, once you have placed that order you can easily amend it directly on the chart simply by moving the blue horizontal bar to the level at which you wish the order to execute.
As with setting a new order, to create a price alert in the first place you can simply right click on the chart and choose ‘Set Price Alert’.
And now in order to amend an alert in the chart, simply move the orange horizontal bar to the price at which you wish the alert to be activated. Once the alert is hit, the bar will turn grey to show the price level has been triggered and the alert is no longer active.
Pairs View
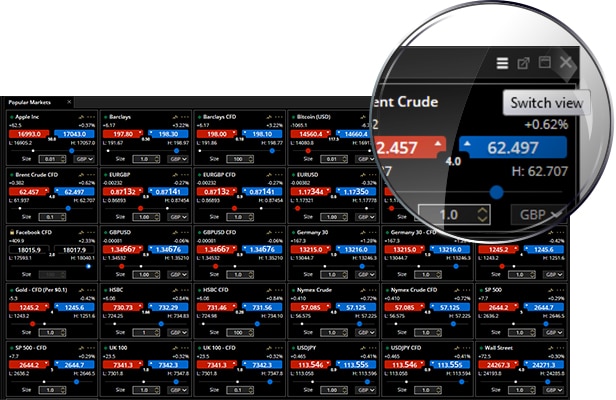
The pairs view feature offers a view of price action that offers additional insight versus just using charts.
Each market tile displays all the key data, including the bid and ask prices, the spread, the amount the market has moved that day, the percentage move and the high and low of the day. You can open charts direct from this view.
It’s also possible to trade direct from the Pairs View markets by clicking on the blue bid price to buy, or the red ask price to sell. Assuming you have sufficient funds your trade will be executed instantly. You can amend the stake size and currency before you click to trade.
A unique feature of the Pairs View is the Change of Day Meter. This horizontal bar is a simple easy-to-view way of gauging where the market is that day.
The smaller white dot shows where the market closed the previous session. The larger of the two dots will be coloured blue if the market is up for the day, or red if it is down. The position of this dot tells you where the current market price is in relation to the high and low of the day. If the market is at the extreme right hand side it’s at the high of the day. If it’s on the extreme left, it signifies the price is currently at the low of the day.
Split Charts
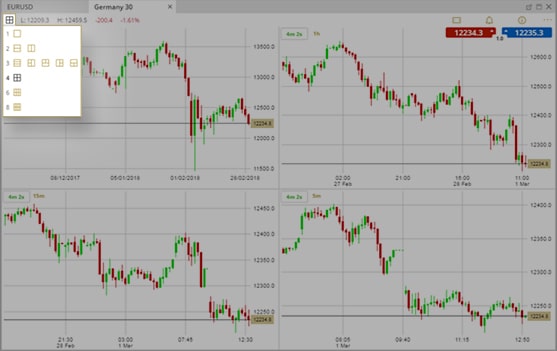
This feature gives you the ability to view up to 8 charts of the same market within a window, giving you a more comprehensive real-time view of price action, enabling easier multiple time frame trading.
For example, you can view a market in different time frames to spot how short-term price action relates to longer-term trends; and use different technical indicators for different charts. You can customize each of the individual charts and save the settings for future use.
Read our full ETX Capital Review here.

Richard is the founder of the Good Money Guide (formerly Good Broker Guide), one of the original investment comparison sites established in 2015. With a career spanning two decades as a broker, he brings extensive expertise and knowledge to the financial landscape.
Having worked as a broker at Investors Intelligence and a multi-asset derivatives broker at MF Global (Man Financial), Richard has acquired substantial experience in the industry. His career began as a private client stockbroker at Walker Crips and Phillip Securities (now King and Shaxson), following internships on the NYMEX oil trading floor in New York and London IPE in 2001 and 2000.
Richard’s contributions and expertise have been recognized by respected publications such as The Sunday Times, BusinessInsider, Yahoo Finance, BusinessNews.org.uk, Master Investor, Wealth Briefing, iNews, and The FT, among many others.
Under Richard’s leadership, the Good Money Guide has evolved into a valuable destination for comprehensive information and expert guidance, specialising in trading, investment, and currency exchange. His commitment to delivering high-quality insights has solidified the Good Money Guide’s standing as a well-respected resource for both customers and industry colleagues.
You can contact Richard at richard@goodmoneyguide.com