The Buffett Indicator compares total stock market capitalization to GDP, assessing market valuation. A high ratio suggests overvaluation, while a low ratio indicates undervaluation, helping people investing in the stock market gauge market conditions for long-term investing decisions.
Most seasoned investment professionals know that stock prices and fundamentals are two totally different elements. Sometimes, they herd together. At times, they diverge significantly. The month-to-month correlation between these two variables is never constant. That’s why using valuation metrics to predict stock prices is quite frustrating.
However, Warren Buffett did highlight (see this Fortune article in 2001) that stock prices have to be grounded to some fundamentals, however loosely this connection may be. The fundamental he preferred to use is the GDP of a country (GDP is short for ‘Gross Domestic Product‘). He takes the total equity market capitalisation and measures it relative to the GDP of a country. This ratio is often called the ‘Buffett Indicator’ (see more explanation here).
The ratio’s intuition is straightforward. Whenever the entire stock market capitalisation races ahead of the underlying GDP numbers, it means prices are too expensive relative to the economy. This lowers future market returns. The central idea is that companies’ profits cannot grow much faster than a nation’s GDP forever.
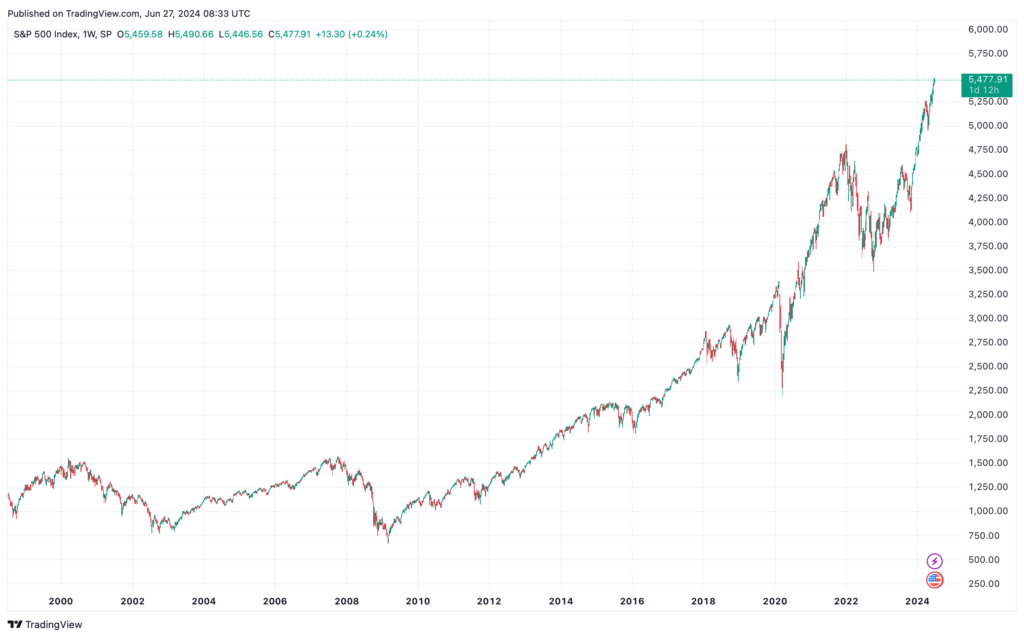
Armed with this concept, I turned to the S&P 500 Index. This blue-chip index has been rising strongly since 2022. in fact, you can argue that the bull market from 2009 is very much intact. From the cyclical low of 666 registered back in March 2009, the index has risen 8x! This is a massive secular bull market – one that was quite unexpected during the Global Financial Crisis. Mind you, the Nasdaq 100 Index has outperformed even more. From the GFC low of 1,000, the index now trades north of 19,000. This is a 19-fold increase in the index value. Few other assets, bar Bitcoin, match the Nasdaq’s stunning performance.
Naturally, investors are concerned. Are prices running ahead of the ‘fundamentals’?
Let’s take a quick look at the Buffett Indicator using the S&P 500. The chart below shows the historical performance of the ratio. The post-pandemic speculative mania kicked this ratio to its highest level ever – 200 percent (see below). After a 1-year correction where the ratio dropped to 150 percent, this has now crept back up near 200 percent. Bear in mind the S&P only makes up half of the total market cap (see last chart here), in reality the Buffett ratio could be even higher than 200 percent.
One factor driving the S&P upwards is the increased concentration of mega stocks. Last I checked, there are now five stocks in the US valued above $2 trillion. Amazon (AMZN) is the latest Big Tech to propel above $2 trillion market cap for the first time this week. These tech stocks are dragging the Buffett ratio higher. But mid- and small-caps are not. Thus, we are talking about a highly bifurcated market.
Earnings are, too, flowing to these mega-cap companies. Google’s net income in 2023 was nearly $60 billion; Microsoft’s was $72 billion. Not many companies earn US $10 billion net a year, let alone $50 billion. In the UK, HSBC’s total net income for 2023 was $23 billion – about a quarter of Apple’s $96 billion net. Immediately, you can see why investors love these US Big Tech and why they’re worth trillions of dollars. They are simply profit machines churning out dollars every day.
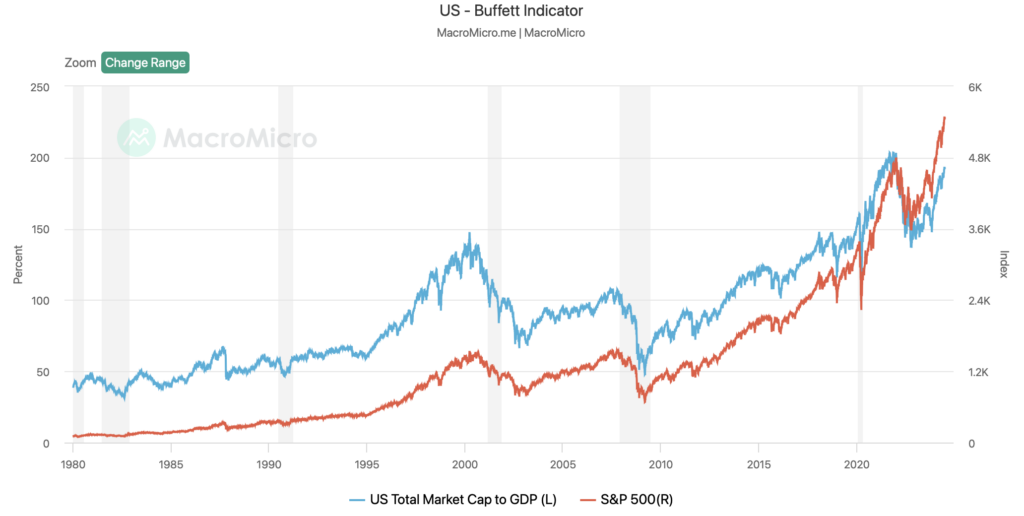
Source: MacroMicro
Ray Dalio, the hedge fund guru, pointed out earlier this year that he did not see a massive stock bubble simply because of these growing earnings and revenue. He stated that “we find the comparison to the tech bubble helpful for explaining why we do not see a bubble today.” This is because “the path of cash flows has been quite different. Nvidia’s two-year forward P/E is around 27 today, reflecting that, even as the market cap has grown ~10x, earnings have also grown significantly and are expected to continue to grow over the next year or two because of actual orders that we can validate.”
But to be fair, that was almost six months ago. Since then, Nvidia has shot up spectacularly. It may not be highly overvalued, but investors are pricing in a lot of positive developments.
Back to the Buffett indicator. If this ratio is racing back to its historic bubbly peaks, should we start to protect ourselves? Perhaps over time investors should aim to increase the cash component of their portfolio, waiting patiently for a correction. The other possibility is to maintain some sort of hedge against a market downturn.
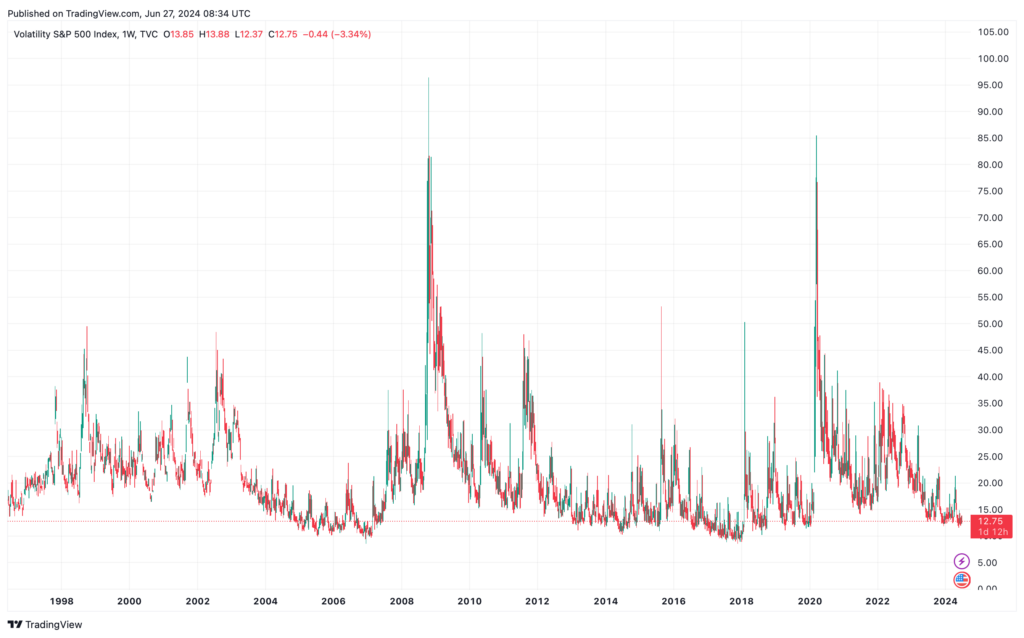
For example, volatility is cheap now. Even during a long bull market, this volatility index can shoot up quite sharply at times. Buying derivatives (eg Put Options) could be one way to take advance of the low volatility; buying the vol ETFs directly may be another (eg iPaths S&P Volatility, ticker VXX).

Jackson is a core part of the editorial team at GoodMoneyGuide.com.
With over 15 years of industry experience as a financial analyst, he brings a wealth of knowledge and expertise to our content and readers.
Previously, Jackson was the director of Stockcube Research as Head of Investors Intelligence. This pivotal role involved providing market timing advice and research to some of the world’s largest institutions and hedge funds.
Jackson brings a huge amount of expertise in areas as diverse as global macroeconomic investment strategy, statistical backtesting, asset allocation, and cross-asset research.
Jackson has a PhD in Finance from Durham University and has authored over 200 guides for GoodMoneyGuide.com.
You can contact Jackson at jackson@goodmoneyguide.com