The Magnificent 7 stocks have driven the US equity markets to new peaks in 2023 and contributed almost one-third of the S&P 500’s +23.0% gains year to date. But can this continue in 2024?
What are the magnificent seven stocks?
The magnificent seven stock as some of the biggest and best performing US stocks including:
- Microsoft (MSFT),
- Apple (AAPL),
- Nvidia (NVDA),
- Amazon.com,
- Meta Platforms (META),
- Tesla (TSLA)
- Alphabet (GOOG)
We can get a flavour of just how much difference these mega-cap stocks have made to the performance of the broad-based US equity index, by comparing the market cap weighted S&P 500 (in black) to its equal weight counterpart IQX (in red). Which we do in the chart below.
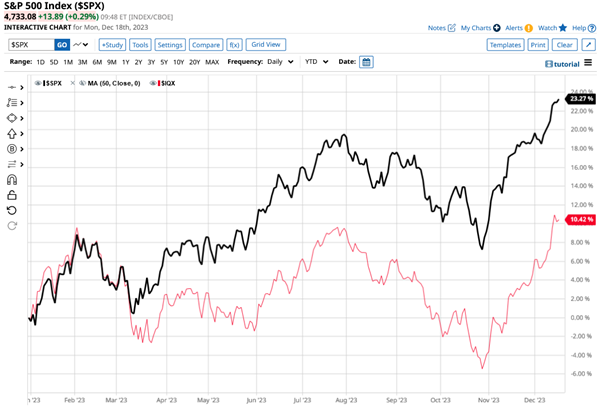
The cap-weighted version of the index has beaten the equal-weight measure hands down much of that differential can be laid at the door of the Magnificent 7.
No bubble yet?
Yet whilst all 7 stocks are up year to date, over the longer term there is quite a bit of variation in their performance, with Tesla, Amazon and Alphabet’s stock prices being down over a two-year time frame.
It is also interesting to note that in November 11 out of 13 S&P sectors saw their equal-weight indices outperform their cap-weighted versions. This could suggest that the “mood music” in the market is changing.
There’s an adage that says the “larger they come the harder they fall” so could that be the case for the Magnificent 7?
Well, even though Nvidia trades on a forward PE 43.70 times earnings, Amazon on 73.70 times and Tesla on 96.30, the Magnificent 7 are not overvalued in historical terms, or at least they are not in a bubble.
According to research from Bank of America, the Magnificent 7 would need to see their valuations rise by +55.0% before they reached half of the multiples attained by the top 7 technology stocks, during the Dotcom boom of the late 1990s.
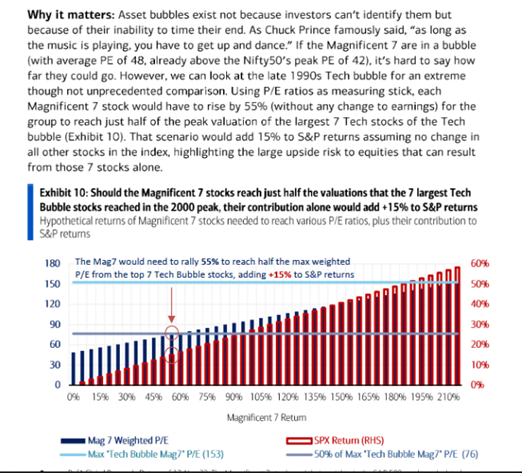
Source: BofA research
Leadership roles
Leadership in the stock market is dynamic and the list of stocks that led the markets 10 or 20 years ago is very different from those that do so today.
Two pieces of research reinforce this point the first is from JP Morgan Asset Management and dates from 2014.
In the report entitled “The Agony and the Ecstasy” JPM AM looked at the history of the Russell 3000 constituents between 1980 and 2013 and they found that:
“Using a universe of Russell 3000 companies since 1980, roughly 40% of all stocks have suffered a permanent 70%+ decline from their peak value. For Technology, Biotech and Metals & Mining, the numbers were considerably higher.”
JPM AM also found that:
“The return on the median stock since its inception vs. an investment in the Russell 3000 Index was -54%. Two-thirds of all stocks underperformed vs. the Russell 3000 Index, and for 40% of all stocks, their absolute returns were negative”
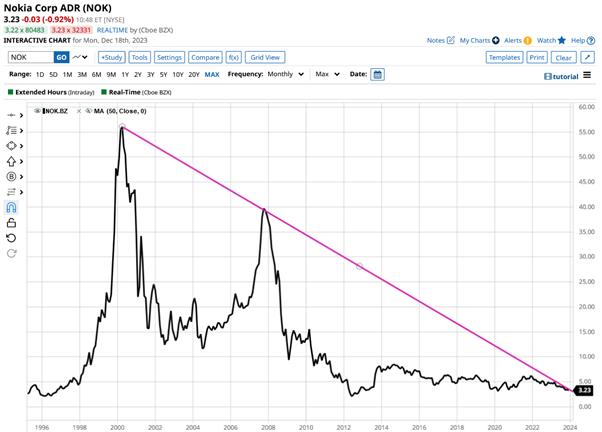
So a place in the Magnificent Seven today doesn’t guarantee continued success. As we can see from this long-term chart of telecom equipment manufacturer Nokia. Once one of the world’s largest companies, but, whose share price, has spent most of the last 20 years in a pronounced downtrend.
Wealth creation
A second, and more recent piece of research, from Morgan Stanley Asset Management entitled “Birth, Death and Wealth Creation” looked at what the firm called “corporate demographics”
The note highlights the work of Hendrik Bessembinder, a professor of finance at Arizona State University.
Professor Bessembinder found that:
“Nearly 60 percent of companies that have been public in the U.S. over the last century or so have failed to create value, defined as earning total shareholder returns in excess of one-month Treasury bills. And only 2 percent of companies were responsible for more than 90 percent of the aggregate net wealth creation”
The chart shows wealth creation in US$ billions of various stocks vs longevity of the companies.
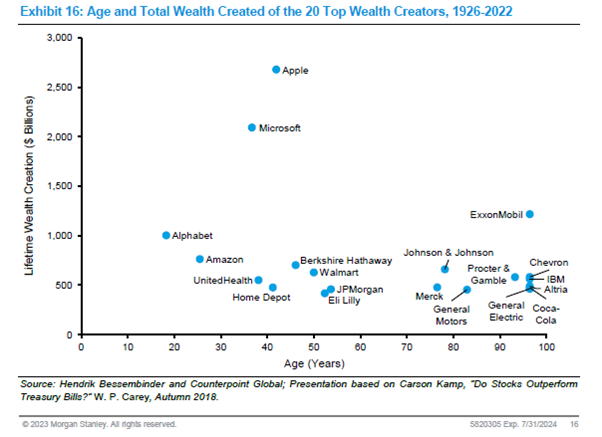
What is interesting about this chart, in the context of the Magnificent 7 is that four of those stocks feature in the graphic, with Apple and Microsoft leading the pack.
Risks
However, there is a cautionary tale here as well in the form of Exxon (XOM), which was once the largest company in the world but whose share price has remained largely unchanged over the last 10 years.
The grouping in the chart suggests that over time earnings and growth flatten out and excitement around a stock(s) decays.
For example, GE, General Motors and IBM have all been market leaders in their day. However, those market-leading credentials have faded away with the passage of time, changes in the economy and investor appetites.
It’s hard to imagine this happening to the Magnificent 7 but if history is any guide that is the fate that awaits some or all of them further down the line.

With over 35 years of finance experience, Darren is a highly respected and knowledgeable industry expert. With an extensive career covering trading, sales, analytics and research, he has a vast knowledge covering every aspect of the financial markets.
During his career, Darren has acted for and advised major hedge funds and investment banks such as GLG, Thames River, Ruby Capital and CQS, Dresdner Kleinwort and HSBC.
In addition to the financial analysis and commentary he provides as an editor at GoodMoneyGuide.com, his work has been featured in publications including Fool.co.uk.
As well as extensive experience of writing financial commentary, he previously worked as a Market Research & Client Relationships Manager at Admiral Markets UK Ltd, before providing expert insights as a market analyst at Pepperstone.
Darren is an expert in areas like currency, CFDs, equities and derivatives and has authored over 260 guides on GoodMoneyGuide.com.
He has an aptitude for explaining trading concepts in a way that newcomers can understand, such as this guide to day trading Forex at Pepperstone.com
Darren has done interviews and analysis for companies like Queso, including an interview on technical trading levels.
A well known authority in the industry, he has provided interviews on Bloomberg (UK), CNBC (UK) Reuters (UK), Tiptv (UK), BNN (Canada) and Asharq Bloomberg Arabia.
To contact Darren, please see his Invesdaq profile.

