

In this week’s analysis, we look at why stock market strength may be misleading when measured against Gold, and how investors should diversify to prepare for potential market instability rather than chasing late-cycle gains.
Why are equities ignoring the oil shock?
In last week’s Macro, I pondered the strange rally in equities and a calamitous energy outlook.
It seems I’m not the only one. In the fabulous FT weekend essay written by Gillian Tett (entitled: Why markets are surging in spite of war, paywall). She wondered about that vexing issue too.
In the essay, she listed five pertinent reasons why stock markets have been going up amidst the gloom in energy markets:
- The Trump administration is highly attuned to the movements of stock prices. So will do anything to prop up the market.
- The US economy is not deeply impacted by the oil shock (due to America’s position as an oil exporter). Asian countries are.
- Steady US corporate profits and strong 2026 earnings guidance are soothing investors’ nerves.
- Global investors are not panicking out of stocks despite heightened geopolitical tensions, perhaps conditioned by recent shocks (e.g., Covid, Ukraine, Tariffs)
- Equity markets are in a late-stage asset bubble, which is irrational and brushes aside any fundamental concerns
Those are good conventional reasons that most investors subscribe to when asked why markets are strong.
But what really caught my attention was one of the astute comments beneath the article, in which the gold-equity performance was highlighted.
But are equities really ‘outperforming’?
Major blue-chip indices like S&P 500 and Nasdaq appeared to be doing well. But if we measure their performances against gold since 2000, more than a quarter of a century ago, their return differences are stark.
Since Jan 2000 (starting point), S&P grew by more than 400 percent while the Nasdaq 100 Index surged nearly 680 percent. These are truly fantastic returns.
Gold, in contrast, rose by more than 1,500 percent from its base price of $280 at the turn of the century! Silver, too, gained immensely ($5.2 to $73, not in table). So despite racking up two cyclical rallies (2003-2007, 2009-2026), S&P is not outperforming gold.
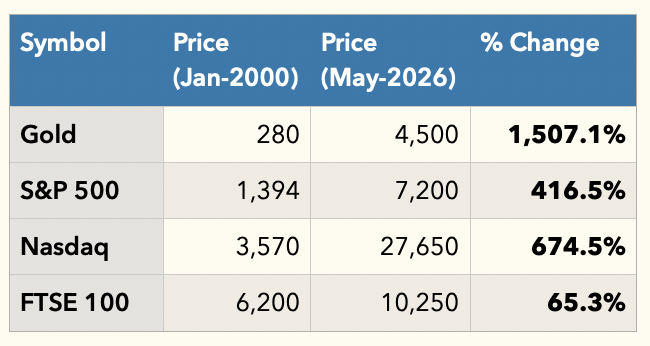
Source: author’s calculations
Of course, equity bulls will vigorously contend that such a (misleading) comparison is due to two critical factors:
- Pure capital returns are inaccurate due to missing dividends, which form a large part of long-term equity returns. Pure price returns understate stock returns
- S&P vs gold comparison is inappropriate because one is a portfolio of 500 stocks, while gold is a single asset.
All these arguments are valid. But the point I’m making is that despite the booming equity markets, they are barely keeping up with gold. Remember, gold does not pay dividends, neither does it grow through productivity increases or buybacks. Still, it kept pace (most likely outperformed) with the S&P.
Back in 2000, one S&P could buy 5 troy ounces of gold. Now, even at 7,200 S&P buys just 1.6 ounces of gold. So in terms of gold purchasing power, S&P has dropped markedly.
The same picture is noted for the blistering Nasdaq, which buys half the gold it could back in 2000 (12x to 6x).
If you look at the UK FTSE 100 Index, prices have barely appreciated since 2000. Even if you include dividends here, its performance hardly kept pace with gold.
This trend is depicted clearly by the famous Dow-Gold Ratio (a ratio of the Dow Jones Industrial Index against gold). The ratio peaked in 1999 and is now slipping against gold (see below).
In summary, the overall equity-vs-gold trend is obvious: while equities are broadly bullish, many indices have not kept pace with gold’s performance over the past 25 years. That’s why Ray Dalio, one of world’s best hedge fund managers, recently advocated investors to up their allocation in gold to 15%.
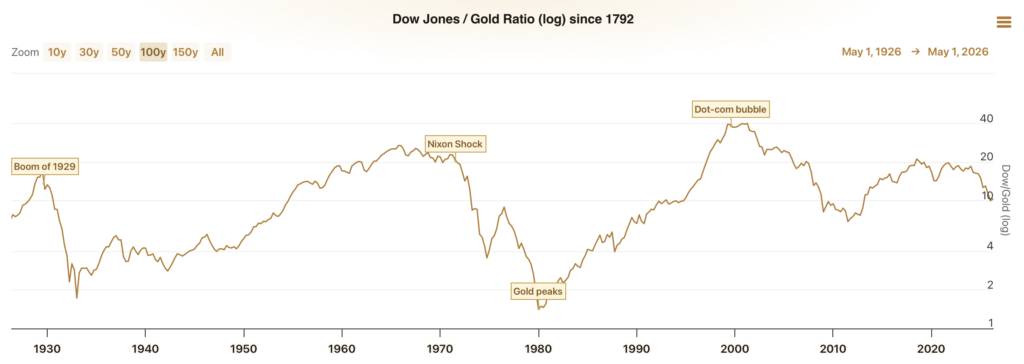
Source: longtermtrends.com
Bonds are the loser in the Iran conflict
If there is one asset class that I have not commented much recently, it is bonds.
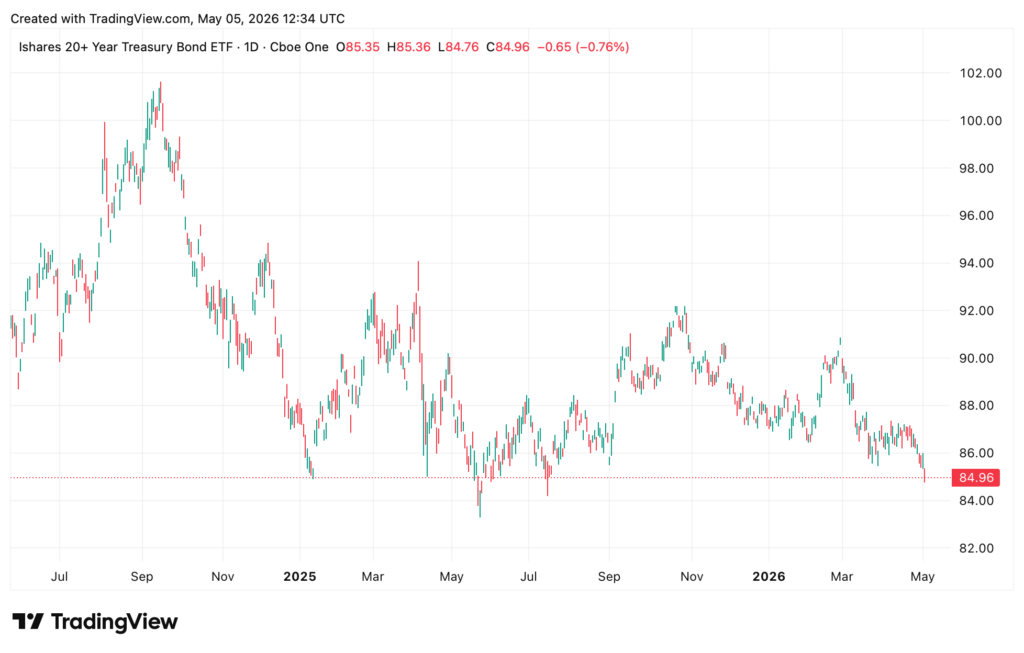
But an ugly breakout is happening there. Take a quick look at the long-term US Treasury ETF (TLT). The price steadiness in April has definitely given way to a decisive slide beneath its March lows.
One core reason for this market dump is that the Strait of Hormuz remains largely closed to traffic. This is squeezing the global oil supply to the limit. Many countries are drawing down their oil storage to critical levels. Even though US is an oil exporter, it, too, is suffering from a looming oil shock. Diesel prices there have rocketed. Eventually, these price increases will lead to much higher inflation figures.
Apart from energy, the picture in the agriculture space is not looking comforting either.
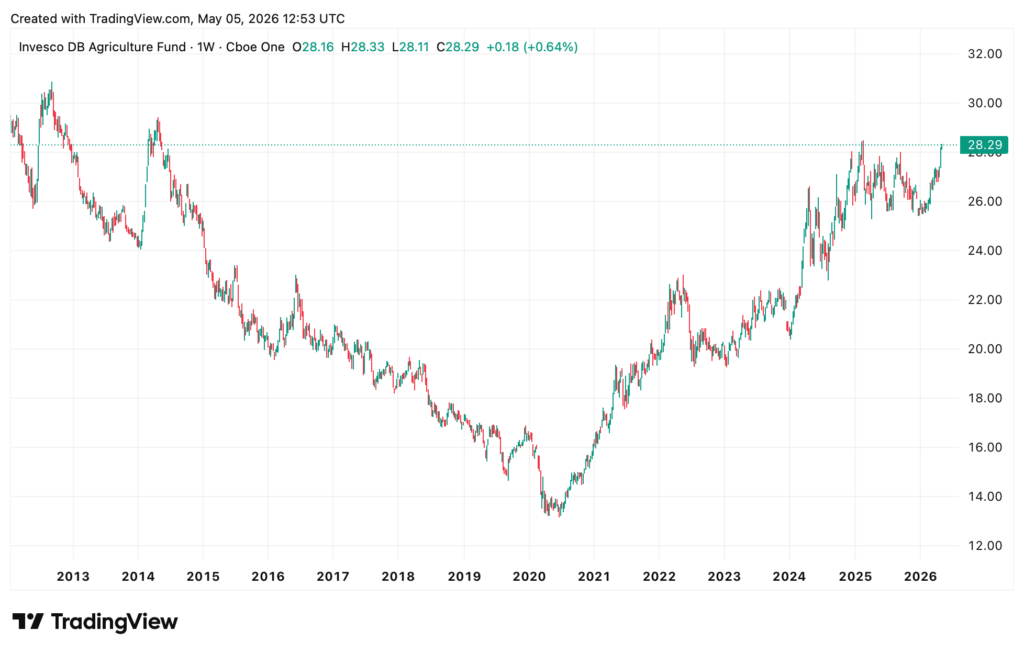
DB Agriculture ETF (DBA), for example, is developing a potential long-term upside breakout. If prices overcome the $28 resistance, a quick rally to $30 is most likely.
At the individual level, Soybean and Wheat have broken out of their base formations; a new cyclical rally appears on the card.
With commodity prices broadly rising, this inflationary pressure will filter down – eventually – to manufacturing processes, household spending, and government debt. Already, investors are betting that government bonds will suffer more in the medium term.
UK’s 10-year bond (or gilt) yield just hit new cyclical highs this week, edging above the 5 percent mark. This is the highest borrowing cost since 2007 (see below). The 30-year gilt yield is already at 28-year high!
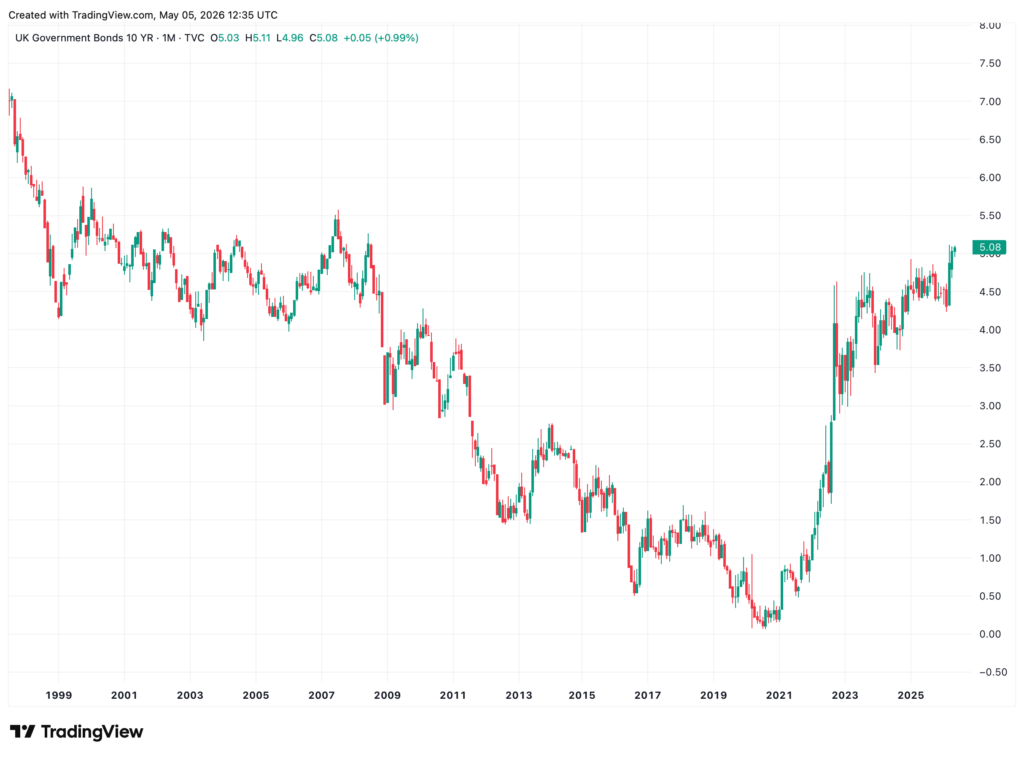
The rally in equity markets appears robust and have many good reasons supporting it. The array of bullish forces range from bullish investor sentiment to the still-rising corporate profits.
But the booming stock market does not change the disturbing picture in other parts of the financial markets. Bond prices are plummeting, borrowing costs skyrocketing and energy supplies are fast dwindling. If these trends are not contained, eventually something will snap.

Jackson is a core part of the editorial team at GoodMoneyGuide.com.
With over 15 years of industry experience as a financial analyst, he brings a wealth of knowledge and expertise to our content and readers.
Previously, Jackson was the director of Stockcube Research as Head of Investors Intelligence. This pivotal role involved providing market timing advice and research to some of the world’s largest institutions and hedge funds.
Jackson brings a huge amount of expertise in areas as diverse as global macroeconomic investment strategy, statistical backtesting, asset allocation, and cross-asset research.
Jackson has a PhD in Finance from Durham University and has authored over 200 guides for GoodMoneyGuide.com.