This report lists stocks making new highs on each trading day. Calculated on a closing basis (close against close). Relative highs are calculated on the ratio of the stock’s price to the underlying base index.
UK Shares at 52 Week Highs
Should you invest at record highs?
In the arsenal of trading tactics, buying new highs is one of the most powerful tools investors can employ. Easy to say, but difficult to do. For one good reason: Instead of ‘buy low, sell high’, this tactic embraces ‘buy high, sell higher.’
In one of my other guides, I talked about Relative Strength in markets. Suggesting buying stocks with good relative strength because relative strength tends to persist. Very often, a stock with good relative strength can venture into uncharted territory for a long time.
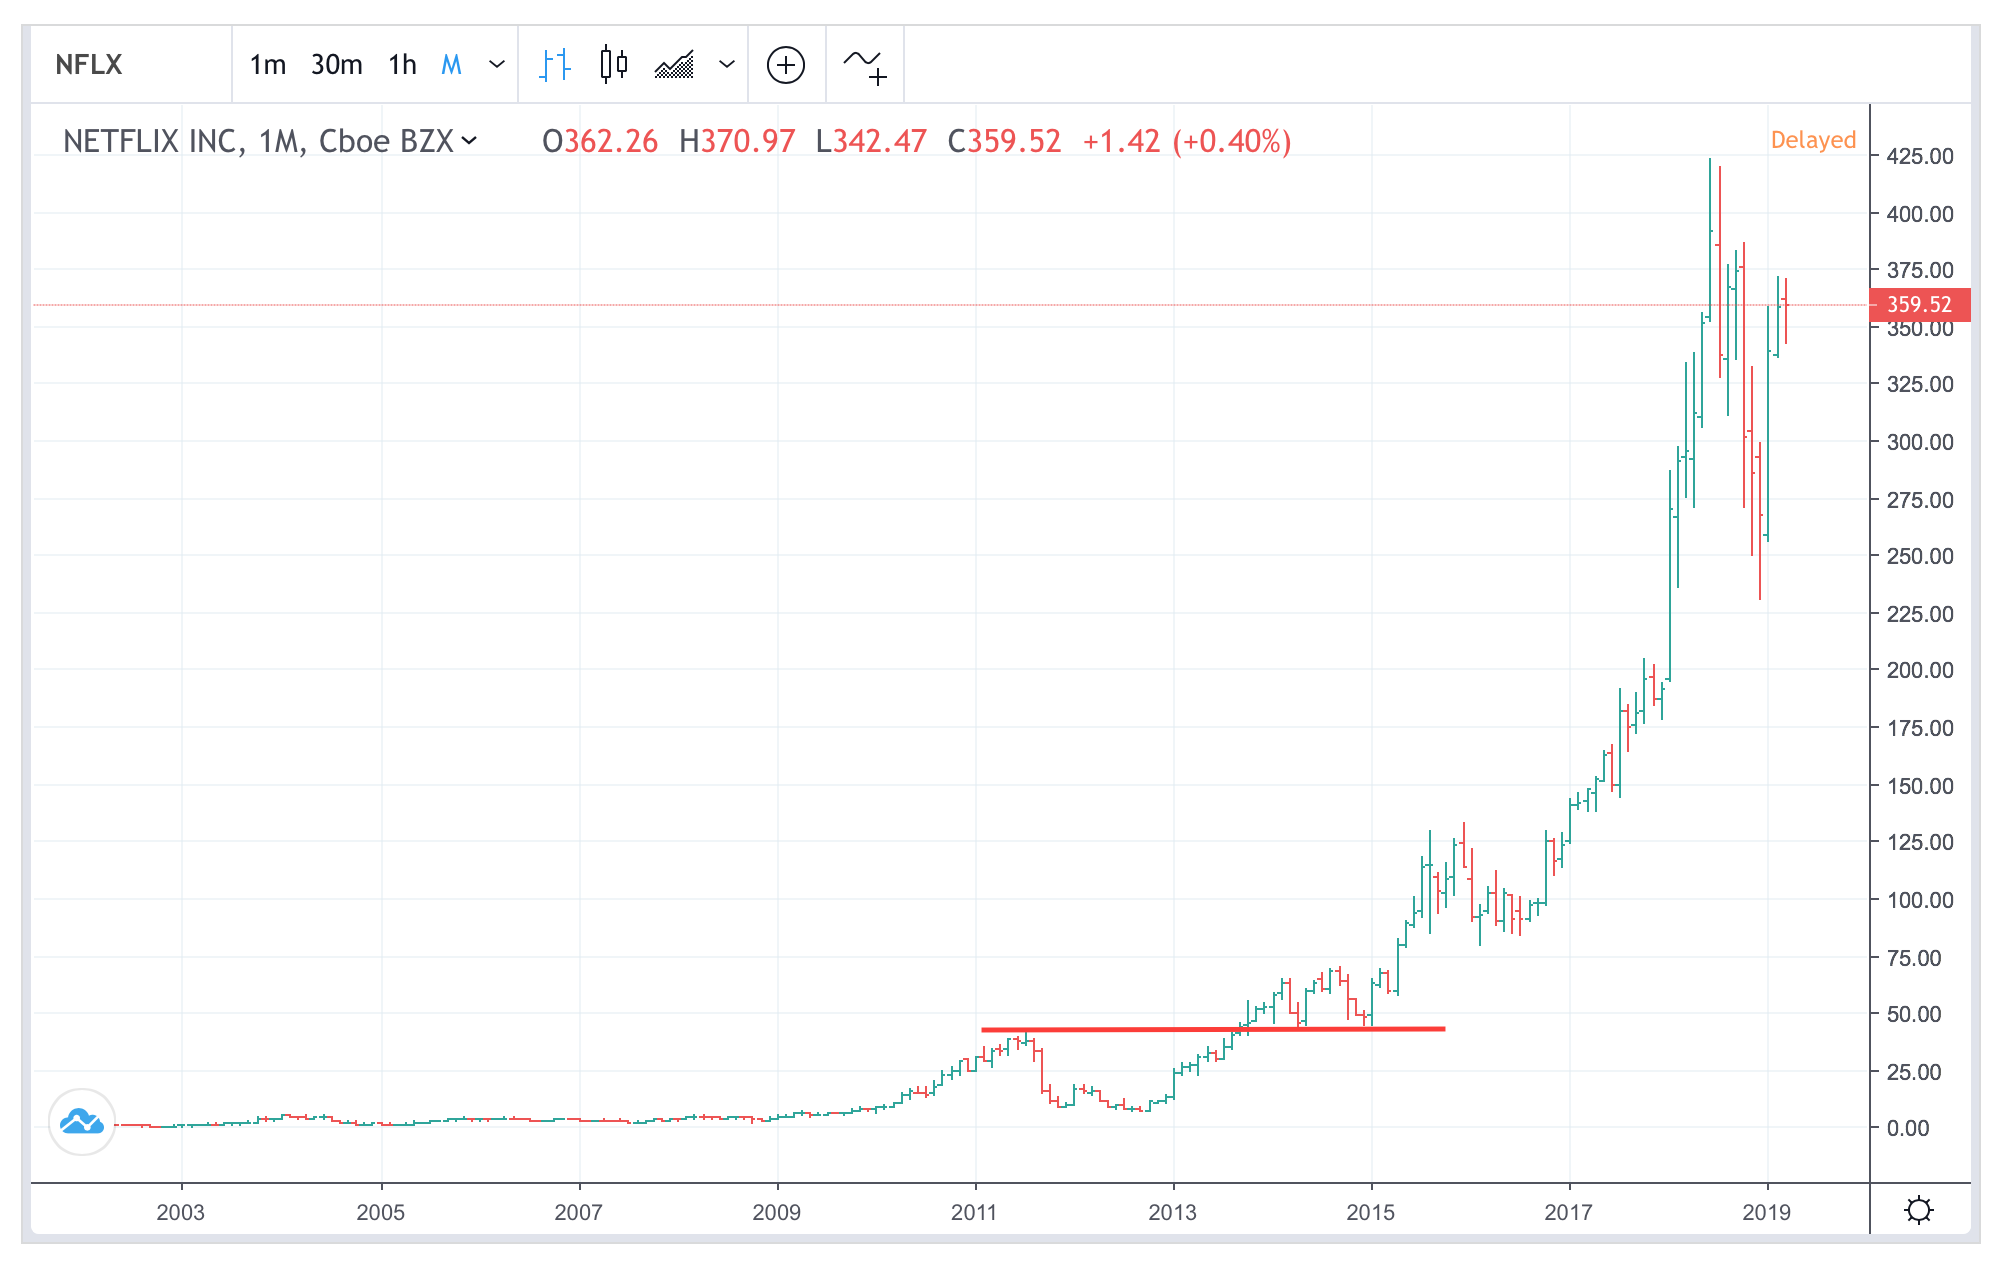
Take Netflix (NFLX). After prices broke new ground in late 2013 and outperformed the market, the stock went rampant and generated new record highs year after year for five years!
Before a stock hit fresh price highs, it edged above the 52-week price level. That’s where experience traders will receive an alert that the stock is ready to breakout and rally.
In an essential study of the impact of 52-Week highs, Bill Hwang concluded that “52-week high price–explains a large portion of the profits from momentum investing. Nearness to the 52-week high dominates and improves upon the forecasting power of past returns (both individual and industry returns) for future returns.”
More importantly, he observed that “future returns forecast using the 52-week high do not reverse in the long run.”
Thus, it is important for traders and investors to pay attention when a stock starts to drift into the vicinity of the 1-year high – because it is a telling sign that the supply-demand imbalance is growing.
- Related guide: Here is compare the best share dealing platforms.
Why new price highs matter in the stock market
New price highs matter for many good reasons.
- Excitement – Stocks at record highs attract media attention. It generates excitement. Look at all the excitement surrounding Ocado (OCDO) when it broke fresh highs, or Tesla (TSLA) new highs back in 2020. In early 2023, FTSE 100 touched new highs and this immediately was taken up by media.
- Profits – New highs mean all shareholders are sitting on profits. So most shareholders will continue to hold for longer. This restricts supply into the market.
- Demand – for stocks that hit new all-time highs is strong. Buyers are plenty; brokers bullish. Even if investors do not understand what the company makes, at least you know everyone wants a piece of that stock. Think Bitcoin in 2017 or 2020. Do all traders really know what Bitcoin does? I doubt it. But everyone knew crypto was a ‘hot’ sector and they desired a piece of the exciting action.
Therefore, a new price high is essential for investors because it tells you that the upward drift is about to get stronger.
Tactics for buying at stockmarket record all-time highs
If you agree that new highs is a good buying tactic, how should you approach it?
Two ways. One is to buy immediately. The other is to wait for a pullback. There are pros and cons in each case.
- Buy now. Chasing after a stock price at new highs means you are likely to pay up. But you are at least ‘in the game’, so to speak. There are a lot of funds that chase after a high-momentum stock. Prices will adjust upwards to reflect this.
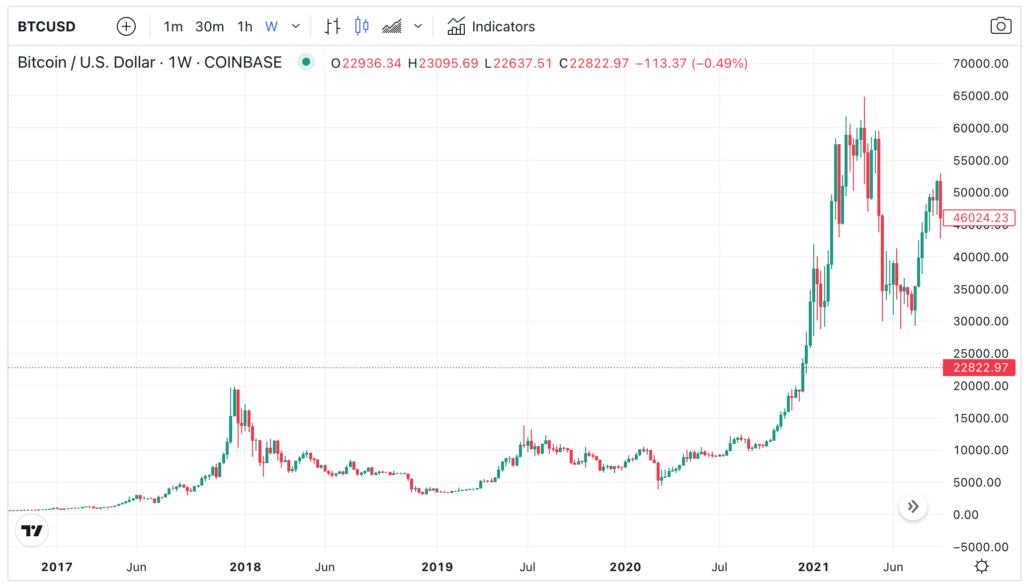
- Waiting for a pullback, however, creates a better entry point. But this pullback is by no means guaranteed to happen. An example of this opportunity cost is aptly reflected in Bitcoin during the last bubble phase.
In late 2020, after years of consolidation, Bitcoin broke above its 2017 high. Traders who waited for a pullback after the breakout at $20,000 would have been disappointed. After that level toppled, Bitcoin surged for the next four weeks. When the digital coin did pull back, the new floor was raised to $28-$30,000. In waiting for a correction, traders would have missed out the biggest gain in the crypto.
In sum, I would probably take a small position as soon as a stock breaks 52-week high – and look to add on new highs and/or on a small pullback.
Other questions to consider when buying stocks at new highs
- Is this the stock’s first new highs? If yes, buy more.
- Stoploss procedure?
- Do you pyramid up? That is, do you buy more as the price rises?
In stock markets, anything can happen for whatever reason. A breakout to new highs – more often than not – leads to further price appreciation. But for whatever reasons prices can also fail to rally further. This is known as a ‘failed break’. Prices briefly advance to long-term highs – and fall back soon after. Nothing is guaranteed in financial markets. You can only trade on probabilities.
As such, having a stop-loss for any trading position is important. Not all 52-week highs will lead to fresh highs. And not all fresh highs can be sustained.
The timing of the new high is another point to watch out. Is the stock market new highs for the first time? Or has it been rallying to record highs year after year? From the perspective of risk, it would be better if you’re early than late.
Experience investors normally want to get on the act fast in the early phase of a bull market, not late. The reason is simple: returns are much higher if you buy at the start of the cycle.
Take this thought experiment. If you “know” the peak of the rally is at $100. Would you buy at $20 or $50? Of course you’d the former because you would made 5x rather than 2x on your original capital. Thus they would jump on the bandwagon as soon as the trend starts to form and ride the stock all the way up.
Funds often ‘leverage up’ if the trend is advantageous. They buy more on minor pullbacks in the early phase of the trend. A word of caution: if you intend on buying more, do so early to catch the trend.
Example: Comparing breakouts
A stock will produce trends and patterns that are completely different to other stocks. As a result, a breakout often leads to different subsequent trends.
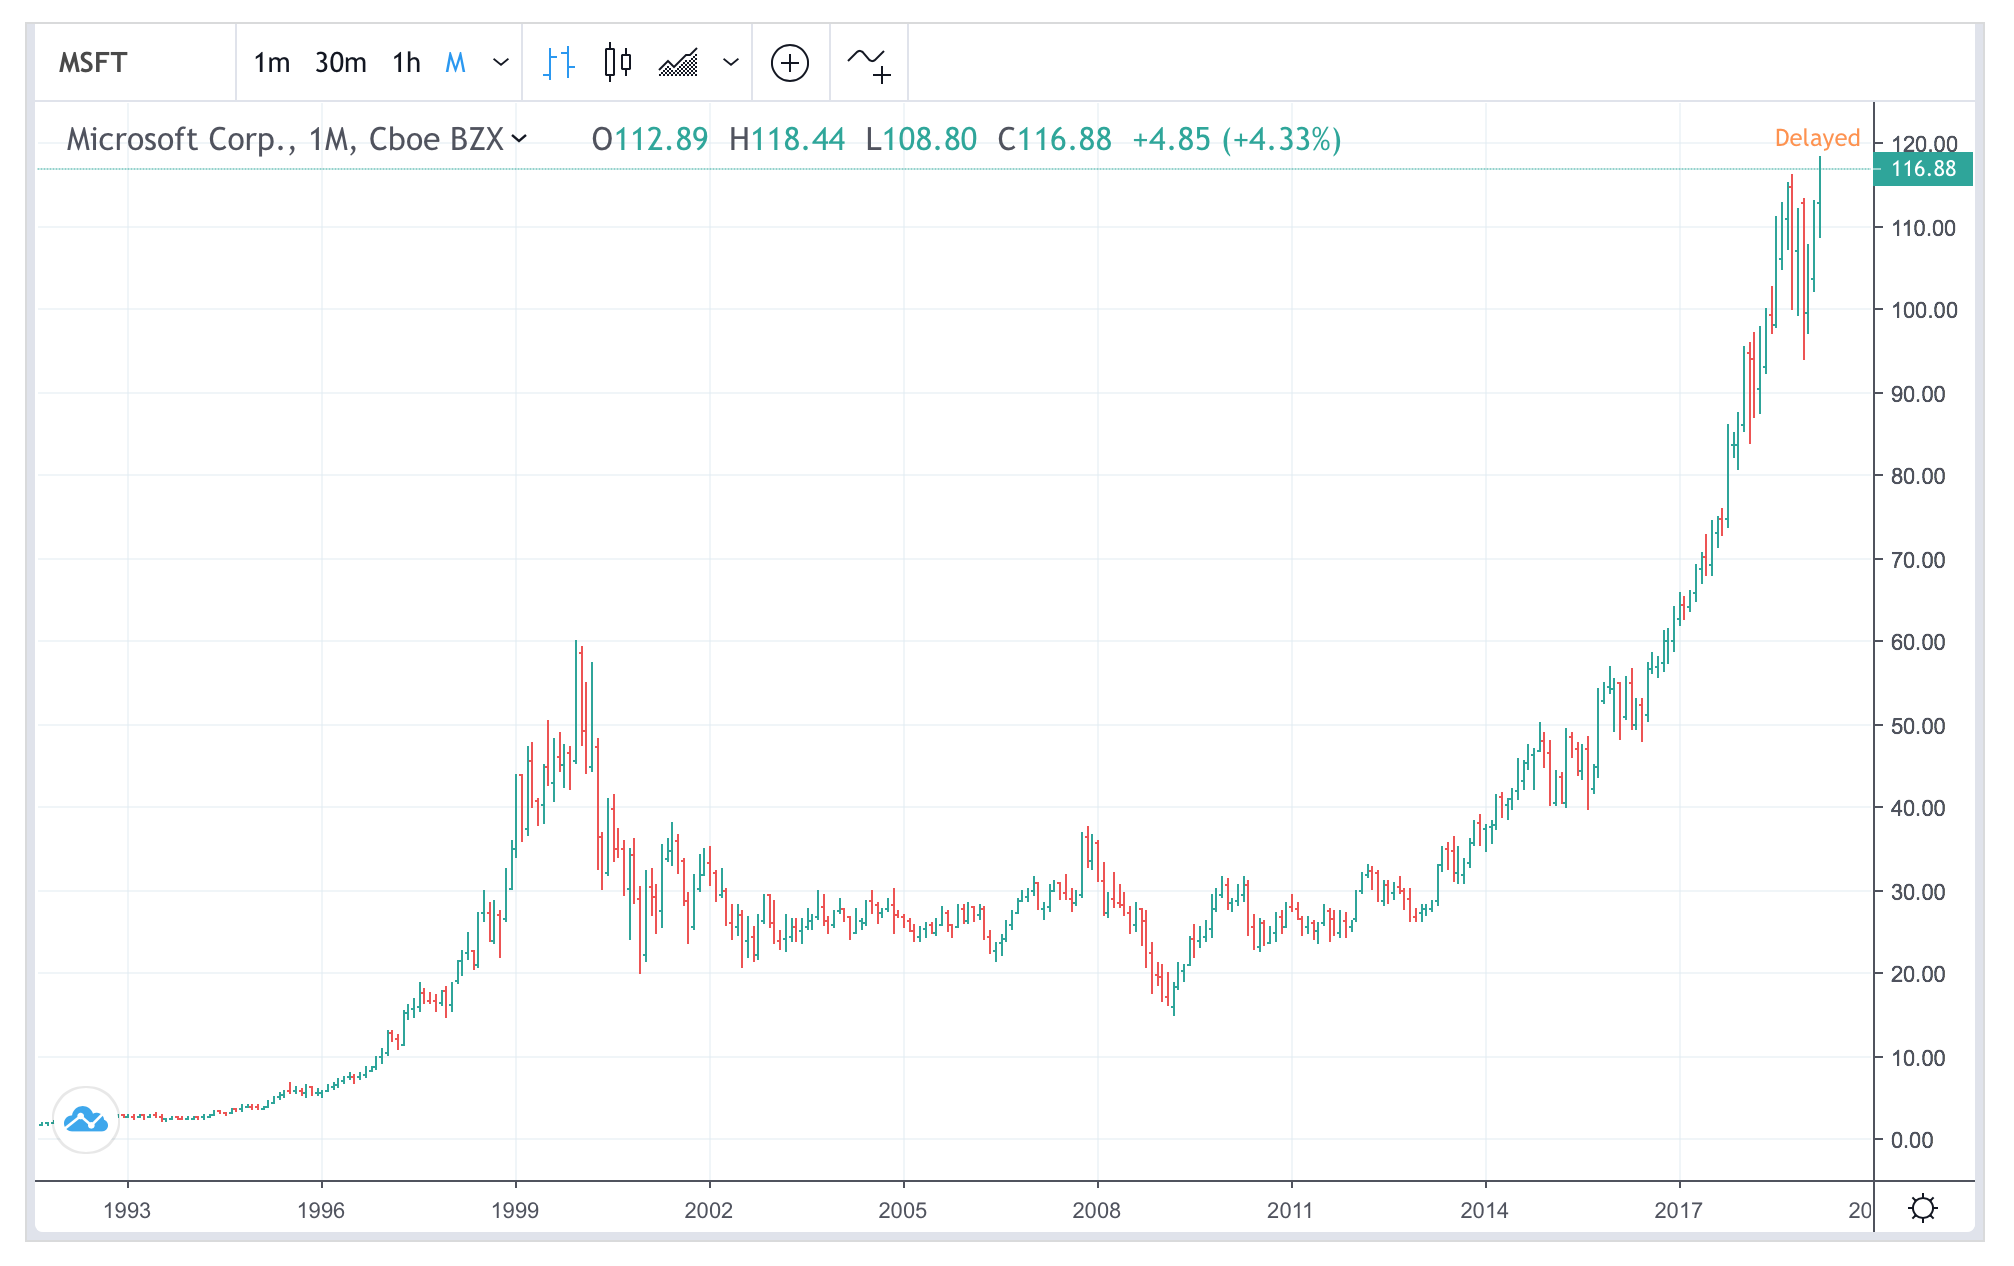
For example, count yourself fortunate if you bought into Microsoft’s (MSFT) breakout at $40 in 2014 because its subsequent trend was extraordinarily smooth, ie, shallow consolidations and persistent new highs. Apparently, its rally is not yet finished yet after four years!
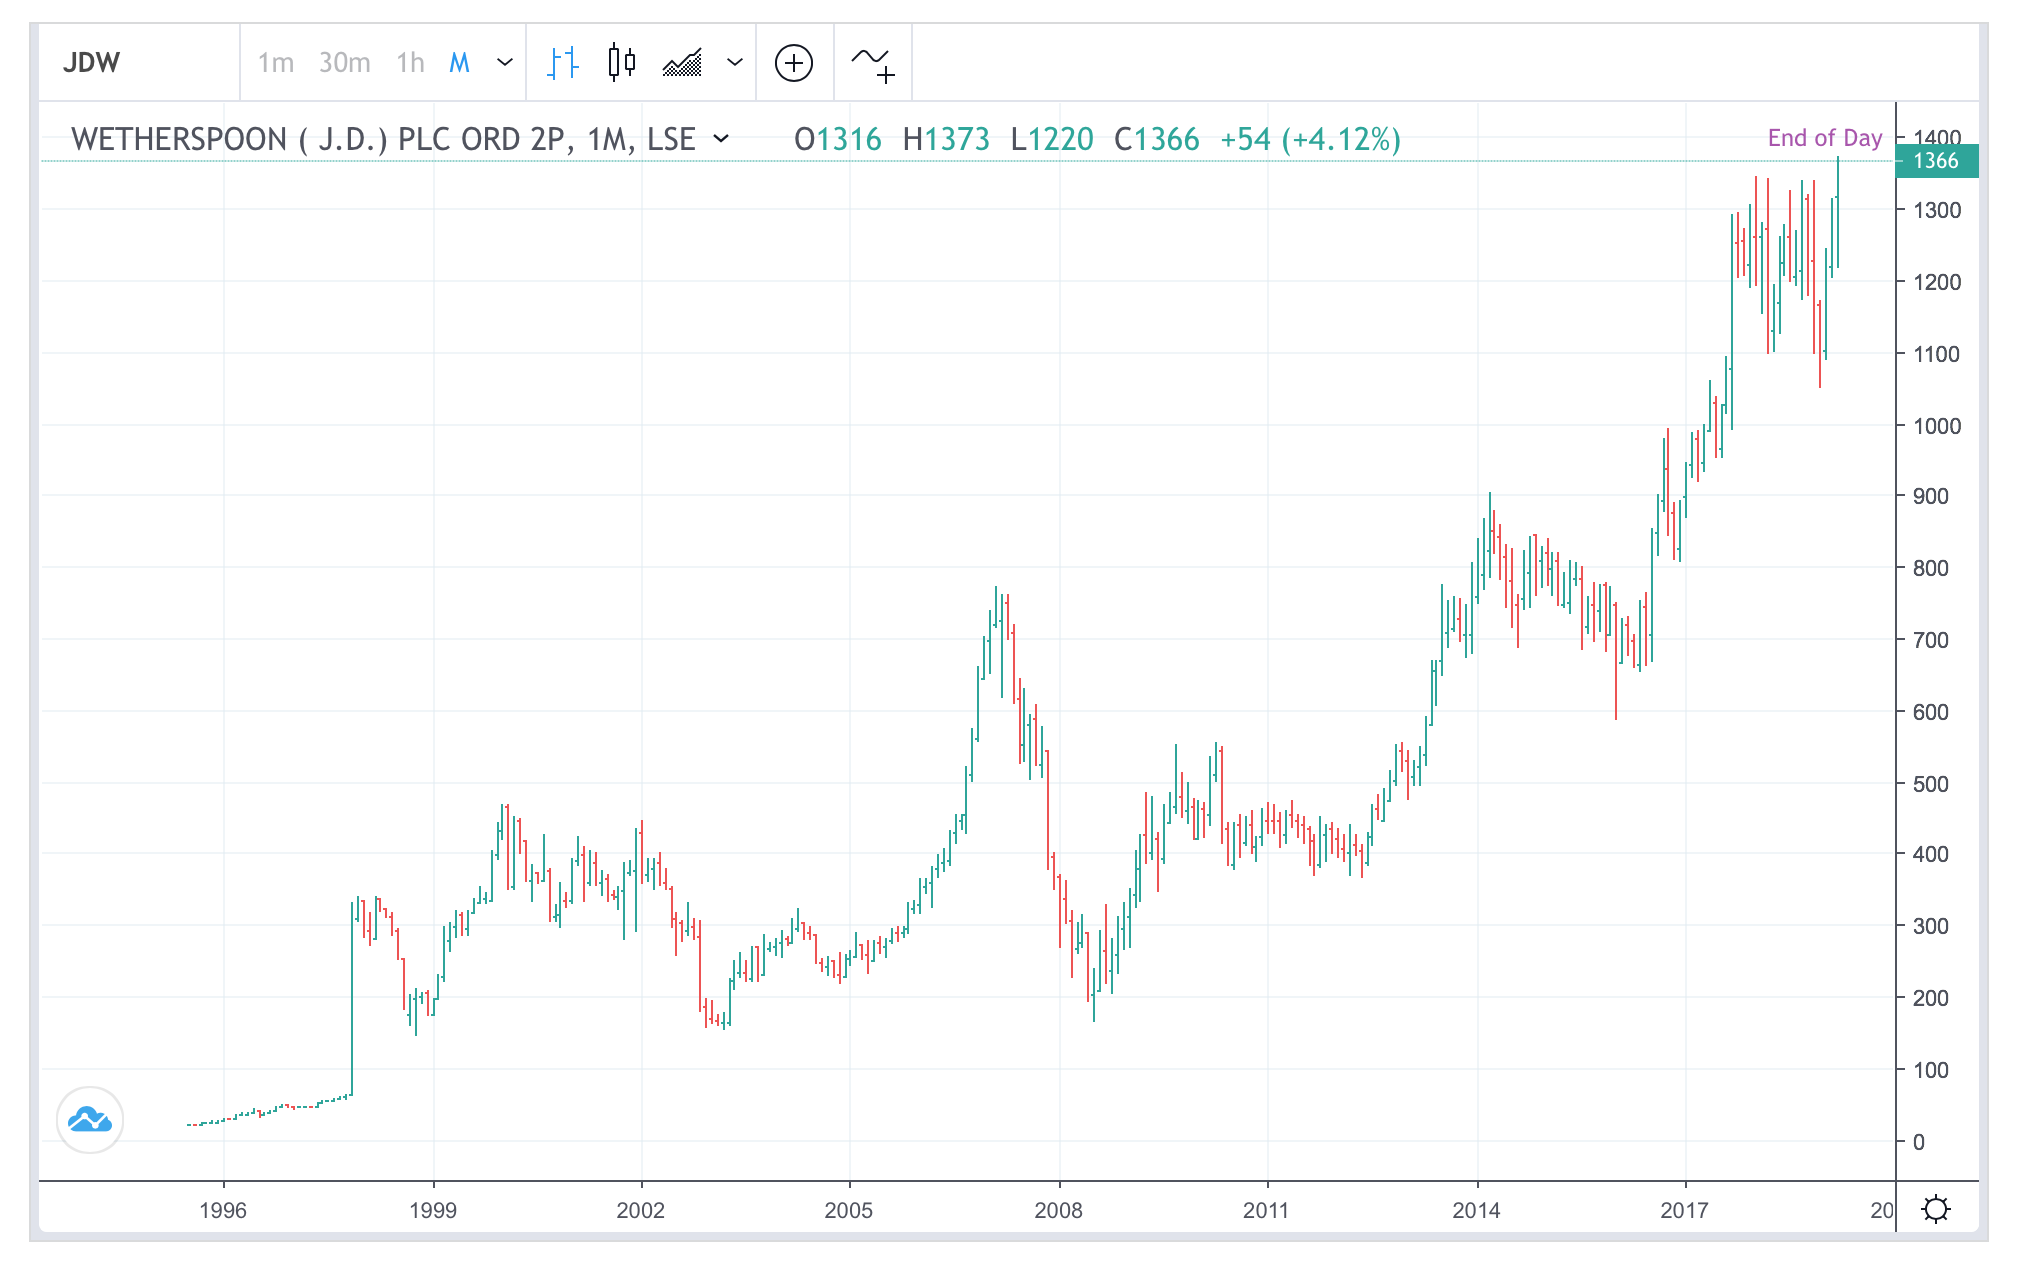
In contrast, look at JD Weatherspoon’s (JDW) trend below. It broke out at the same time as Microsoft in 2014, but it endured a multi-year consolidation before prices took off. Its returns are also far inferior to that of MSFT’s. Tactically, it would better to take a loss here and move on to other better-performing stocks in 2014, and returned here in 2016.
Therefore, having a stop-loss strategy is must. This is because you will never know how a stock will perform after establishing new highs.
Not all new stock market highs are equal
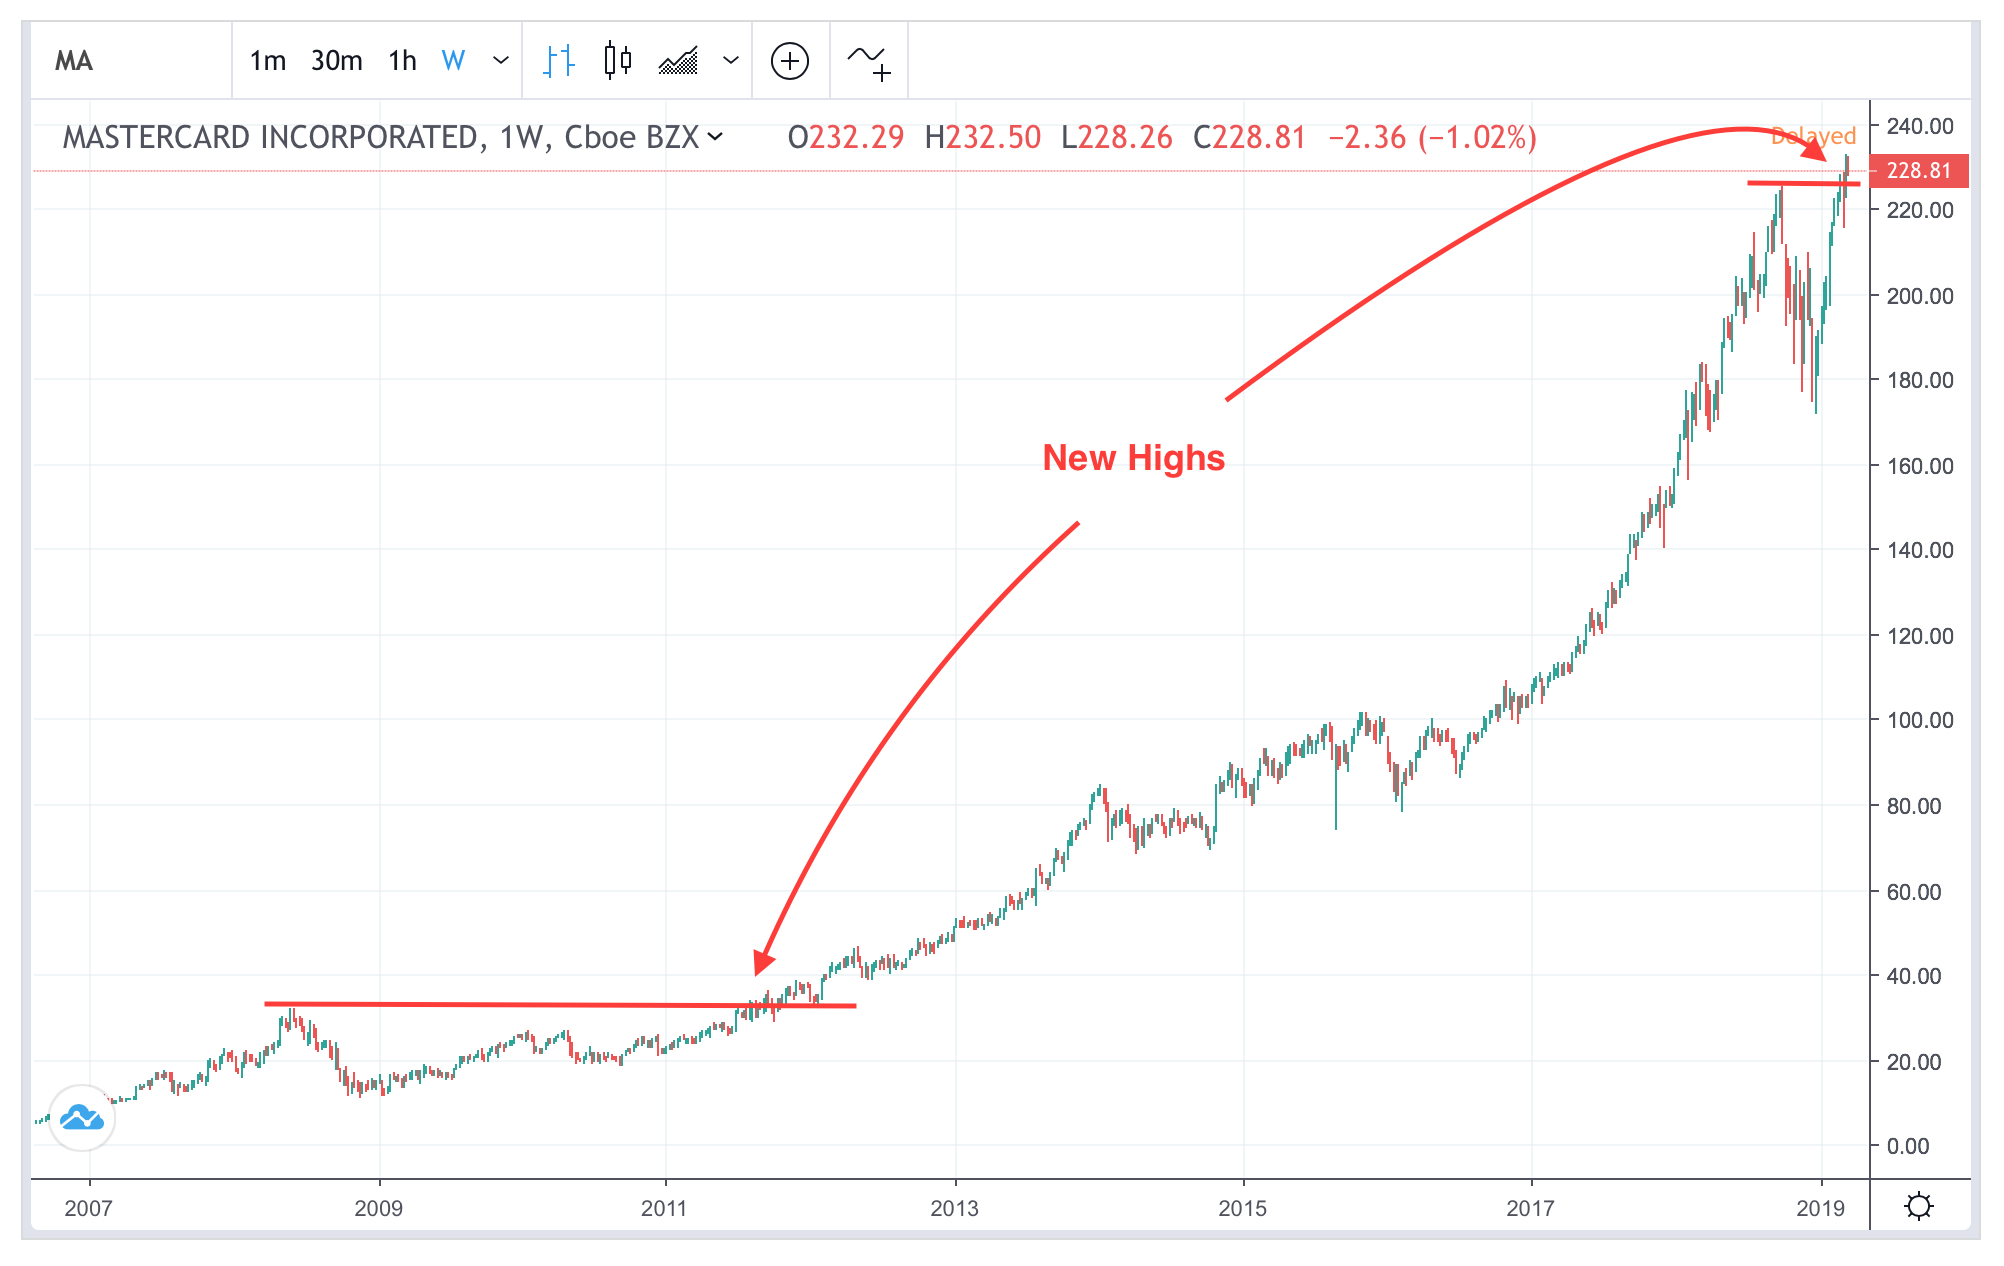
Another point worth stressing is this: Buying new highs after a five-year bull market entails a different risk-reward proposition to a stock that just made its first high. In other words, not all new highs are created equal.
Look at MasterCard (MA). Do you think the latest new high is less or more risky than the one in 2011? After a 7x increase in prices ($30 to $210), I would think more. This means I would avoid pyramiding here. The chance to do it was in the early phase of a stock’s breakout, not after a multi-year advance.
The reason for this is that after a multi-year advance, most stocks would have reached the point of maximum levitation. All buyers that could have bought are already in it. The only direction the stock can take is either flat or down.
Does buying macro instruments at new highs work?
By now, the case for buying stocks at new highs appears to be a sound one. Does this strategy work for macro instruments like equity indices or FX? Yes, but there are some qualifications.
If we are talking about single-instrument macro data like oil or gold, yes they will behave more or less like individual stocks. This is because they are often impacted by issues that are specific to that instruments.
For other macro instruments like equity indices, their trends are harder to break once they are in motion. This is because a major index is comprised of many instruments. For example:
- S&P 500 – has 500 stocks
- FTSE 100 – contains 100 equity instruments
- Nasdaq Composite – 3,633 constituents
Therefore, it is much harder to ‘move’ these indices. But once they are breaking out to new highs, these bullish trends can last for some time. The reason is simple. To rally a stock, higher earnings expectations is sufficient. To move the S&P 500 index, a host of other factors are involved, including corporate profitability, sector composition of the index, business cycles and market valuation.
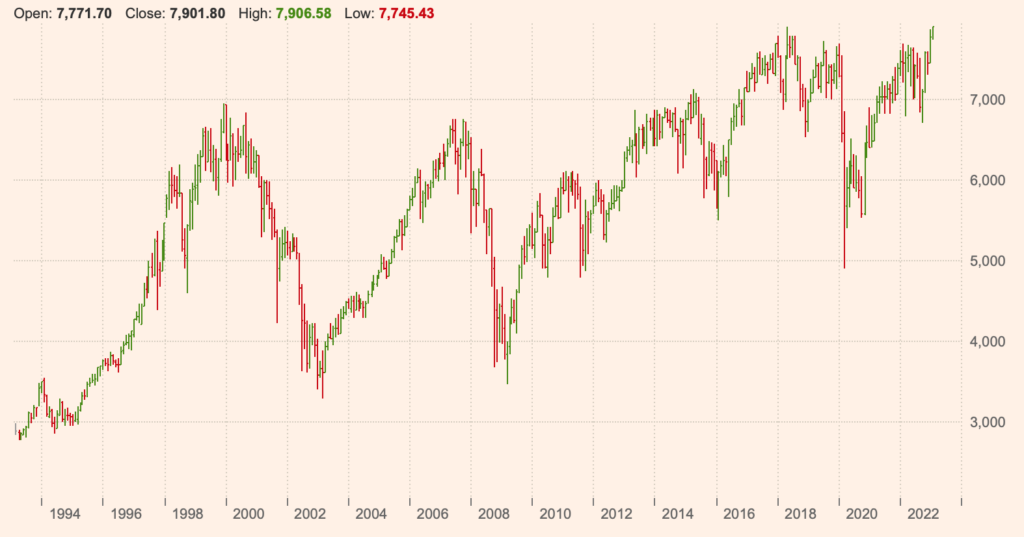
FTSE 100 breaks out!
So how should we view the recent breakout in the FTSE 100? It is well known that the FTSE 100 is heavily weighted by material and energy stocks. These sectors are booming. Shell, for example, just announced a $40 billion profit in 2022.
Moreover, much of the FTSE 100 are large international stocks. They derived their earnings overseas. With Pound Sterling weak these days, these earnings are set to become more valuable in Sterling terms. For local investors, the FTSE 100 is now a ‘hedge’ against a weak domestic economy (according to the IMF, UK is set to underperform even Russia). Hence FTSE 100 is performing much better than the mid-cap or AIM index in 2022 due to these factors.
But technically, FTSE 100 has not had a ‘clean breakout’ since 1998. It would be interesting if it can manage to do one when most other major equity indices are mired in a downtrend.
A final note on buying stocks at new highs
The dynamics for new lows are exactly the same as new highs – but in an opposite manner. When a stock makes new record lows, its bear trend is likely to continue until all available sellers have sold out. ‘Bad news,’ as Warren Buffet observes, ‘often surfaces serially: you see a cockroach in your kitchen; as the days go by, you meet his relatives.” By then, stock prices may have collapsed by 80%. So if you are going to panic about a stock, at least panic early!
Other UK shares trading signals:
- Shares that have recently had a daily breakout
- Shares that have recently climaxed (either at the top or bottom of a range)
- Shares that have recently displayed a “hi-lo” pole
- Shares with an overextended point and figure spike or tail
- Shares that have a short or medium-term reversal signal
- Shares with a recent moving average crossover
- Shares that a trading a 52-week lows