Tech rout traps investors while US presidential race tightens….
A week can be a long time in financial markets. It can also, unbeknownst to many, mark an epochal peak that separates the bull from the bear.
Last week I pointed out the potential rise in market volatility this month. This is because September is historically the weakest month of the year. Indeed, in just five trading sessions Nasdaq peaked and then corrected sharply. Volatility shot up. Many wonder, have we just witnessed one such historic peak, ie, ‘Peak Tech’?
Related guide: How To Use Volatility ETNs (VXX & VXZ) To Protect Your Stock Portfolios
What is going on with the Tesla stock price?
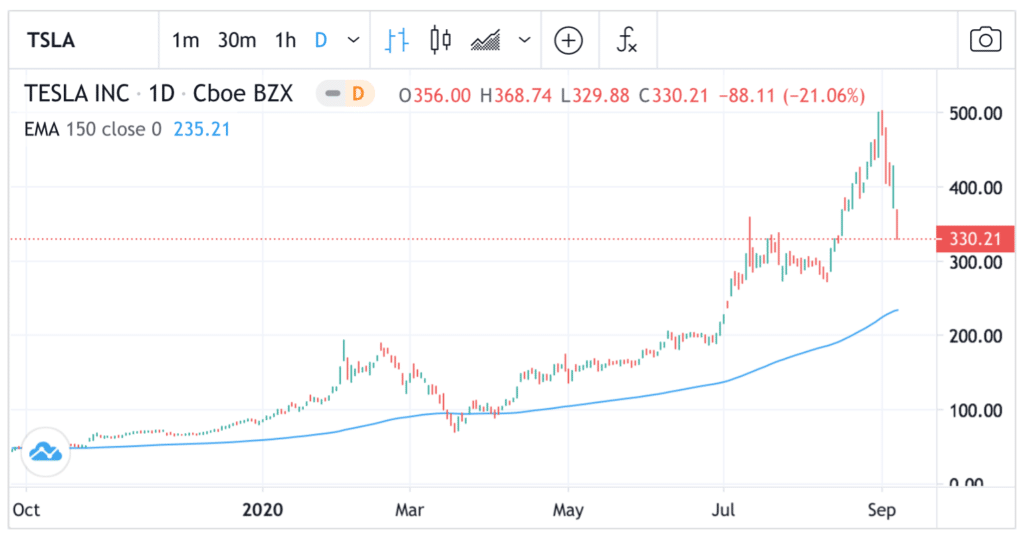
Tesla (TSLA), one of the market leaders in this rampant tech bull, rose to $500 (post split) before plunging 34% to $330. Supporters of the tech sector will argue that Tesla’s nail-biting volatility was caused by its own speculative rally ($100 to $500 in 6 months!) and the weight of a $5bn equity issuance. Yes but this argument ignores the fact many tech stocks are now in correction territory. That is, prices are down 10% from its recent peaks.

Some optimists point out that a correction is healthy during a long-term bull market. Reversions to the mean – prices falling back to its long-run moving averages – are all part and parcel of a secular bull trend. Yes this is true. But don’t forget that the tech bubble was also fuelled by massive funds taking big gambles.
Is Softbank taking too much of a gamble on risk?
Softbank (JP: 9984) was recently unmasked as one of these ‘whales’. Not contented with its portfolio of tech Unicorns and swathes of stakes in listed tech firms, Softbank’s CEO Masayoshi Son poured billions into high-risk equity derivatives based on tech stocks. According to Financial Times, Softbank’s notional exposure based on call options amounted to a staggering $30 billion. Frightened by this revelation, Softbank’s investors deserted the stock in droves.
Related guide: How To Trade Options
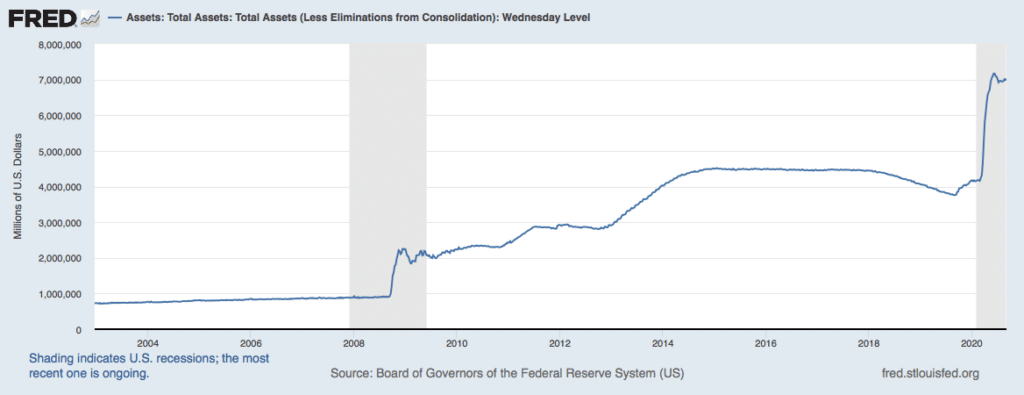
Taking a broader view, however, the latest correction is a clear warning that the post-covid rally is potentially coming to an end. Remember that this surge in stock market was first ignited by the massive Fed QE back in March-June. During that critical 90 days, the Fed, confronted with an economic ‘sudden stop’, pumped more than $3 trillion into the system – as much as QE1-QE3 combined (see below). This pool of surplus liquidity has to go somewhere. As tech firms benefit enormously from the lockdown, this speculative current flowed naturally to tech stocks.
But since peaking above $7 trillion in June, the Fed’s balance sheet has been flattening. This pause is potentially checking the speculative tech bubble. Until the Fed takes active measures to reverse its balance sheet, Nasdaq stocks may stay elevated, albeit in a very choppy manner.

Higher volatility, however, could mask new trends. Investors may pare back bets on tech stocks and rotate into previous laggards, such as banks. Amidst the tech rout, bank stocks have remained fairly steady. A quick look at iShares Financials (XLF) shows a firm price trend with the potential to exhibit new relative strength.
Count down: 54 days to the US Election Day (Nov 3)
Another factor that have prompted investors to take profits in tech stocks is the looming US election. Who will win? Apart from hardcore supporters on both sides, many will promptly predict: ‘Hard to say’. It is easy to see why.
Stung in the last election when a widely-predicted Clinton win was dashed by Trump, pundits learned their lessons. So this time, standard news headlines read, ‘Presidential race tightens‘, ‘Trump and Biden deadlocked in Florida, et cetera. Investors take the hint. Better to cash in some chips before a messy election strikes.
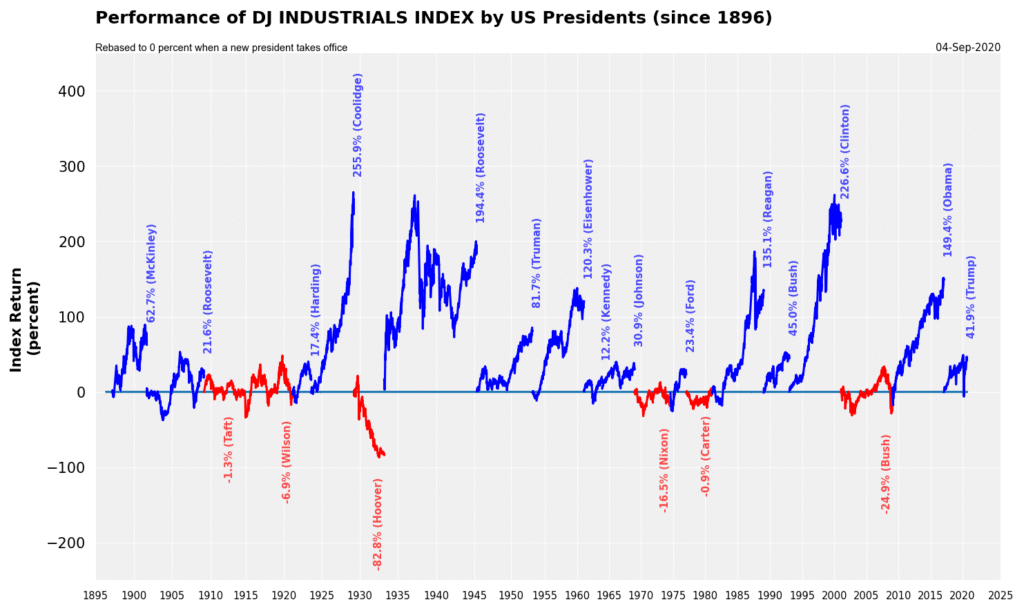
However, when we look back, Donald Trump was not all bad for US stocks. In fact, the American stock markets performed remarkably well during 2017-2020. The first twelve months of Trump saw a ‘Trump Rally’ taking hold. Fuelled by further tax cuts, the bull market during Obama years extended well into the Trump administration.
I did a quick tally of the performance of the Dow Industrials Index (since 1896) under each US president. At +42% (as of Sept 4), the Dow under Trump outperforms many past US presidents. If we use tech indices the outperformance would have been greater.
Normally, sitting US presidents win re-election (Obama, Bush Jr, Clinton). But due to the Pandemic, the election is far from settled. Therefore, investors are likely to use rallies to sell and then wait until the issue is concluded in November.


Jackson is a core part of the editorial team at GoodMoneyGuide.com.
With over 15 years industry experience as a financial analyst, he brings a wealth of knowledge and expertise to our content and readers.
Previously Jackson was the director of Stockcube Research as Head of Investors Intelligence. This pivotal role involved providing market timing advice and research to some of the world’s largest institutions and hedge funds.
Jackson brings a huge amount of expertise in areas as diverse as global macroeconomic investment strategy, statistical backtesting, asset allocation, and cross-asset research.
Jackson has a PhD in Finance from Durham University and has authored nearly 200 articles for GoodMoneyGuide.com.

